
Bitcoin (BTC) price failed to surpass $117,500, trimming gains as the price dropped below $114,000. It might extend losses if it drops below $111,200.
Bitcoin Price Faces Rejection and Bearish Moves
In the last analysis, we saw the start of a recovery wave in Bitcoin above the $112,500 resistance zone. The bulls were able to push the price above $114,000 and $115,000. There was a steady move above $115,500, the 50-day simple moving average (blue), and the 50% Fib retracement level of the main decline from the $123,640 swing high to the $107,540 low.
However, BTC struggled to clear the $117,500 and $118,000 resistance levels. The 61.8% Fib retracement level of the main decline from the $123,640 swing high to the $107,540 low acted as a major hurdle. As a result, the price reacted to the downside and dived below $115,000.
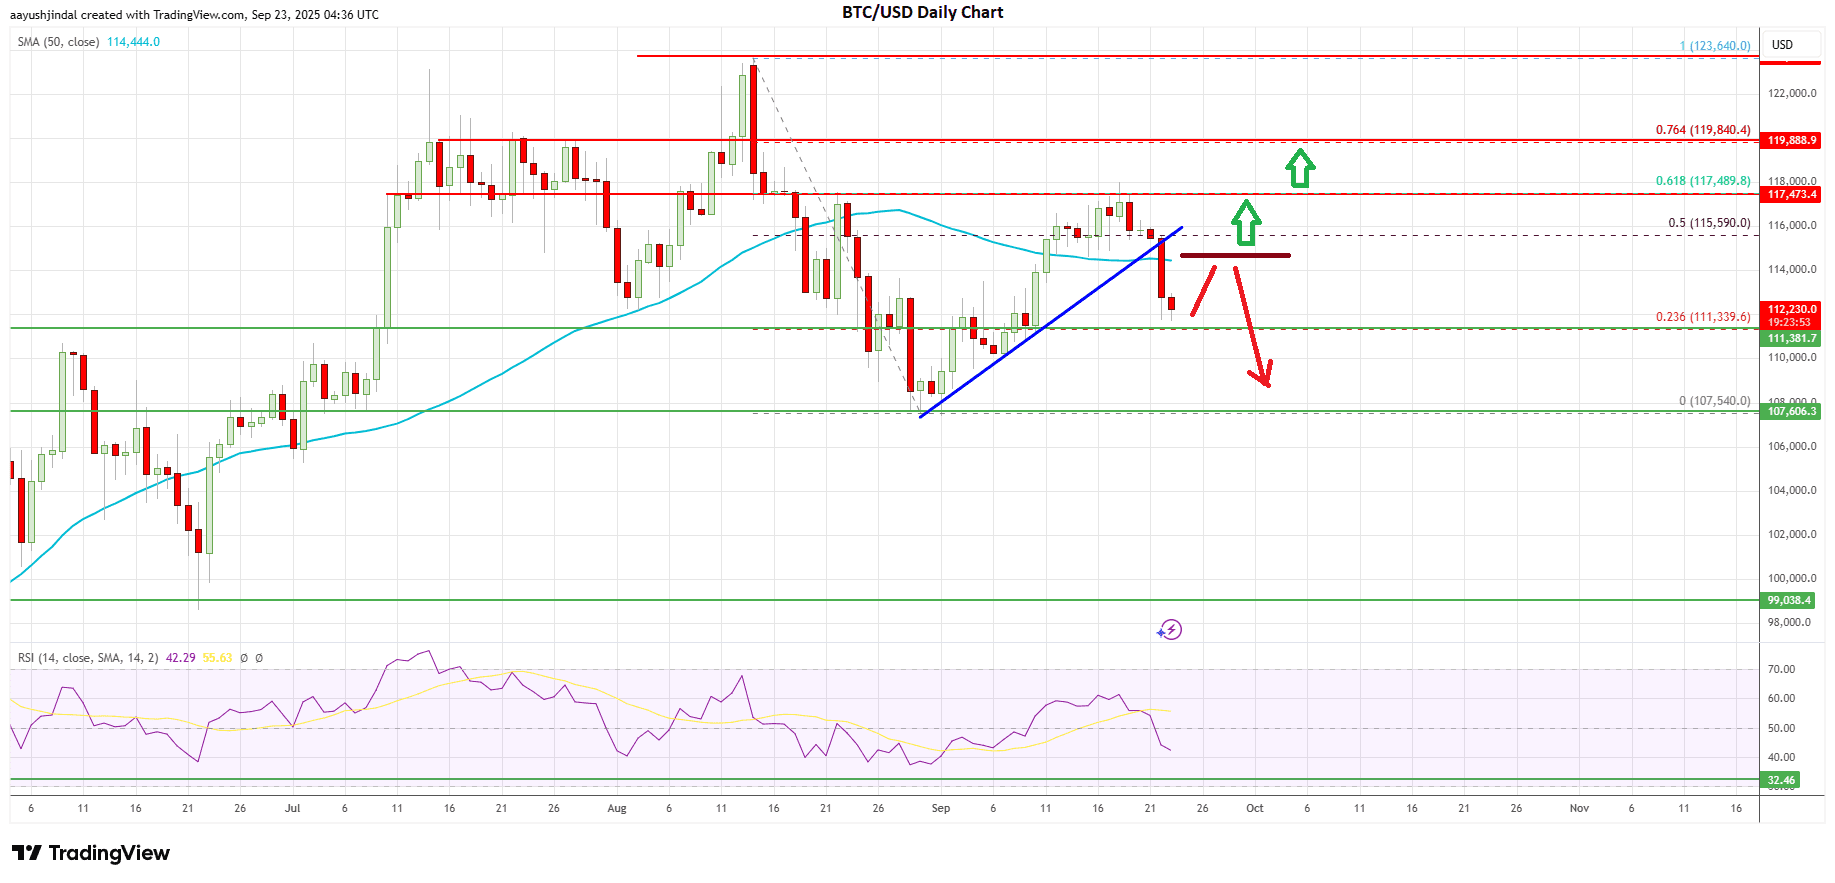
Bitcoin traded below a major bullish trend line with support at $114,000 on the daily chart. It is now trading below the $115,000 pivot level and the 50-day simple moving average (blue).
The bulls are now active above the $111,200 support zone, but the current price action is negative. On the upside, immediate resistance is near the $113,500 level. The first major hurdle is $114,200 and the 50-day simple moving average (blue).

A close above $114,200 might decrease selling pressure and increase the chance of a steady increase. The next key selling zone could be $115,000. If the bulls clear the $115,000 hurdle, it could open the doors for a trend change.
In the stated case, the bulls could attempt a move toward $117,500. The main hurdle for them could be $118,000. A daily close above the $118,000 level could spark heavy bullish moves, and BTC price might rise toward $120,500 level. Any more gains might call for a test of $122,000.
Downside Continuation In BTC?
If Bitcoin bulls fail to push the price above $114,200 or $115,000, there could be another bearish reaction. Immediate support is near $111,200 level.
The first major support is near the trend line and $110,000. A downside break and close below $110,000 might increase selling pressure on BTC. In the stated case, the price could decline toward $108,800. If there is no bounce from $108,800 or $108,500, the price could accelerate lower. In the stated case, the price could test $107,500 support. Any more losses might call for the test of $105,000.
Overall, Bitcoin is showing bearish signs below $115,000. To start a recovery wave and avoid more losses, BTC must reclaim $114,200 and then $115,000. If not, the price could drop below $111,200 and continue lower.