

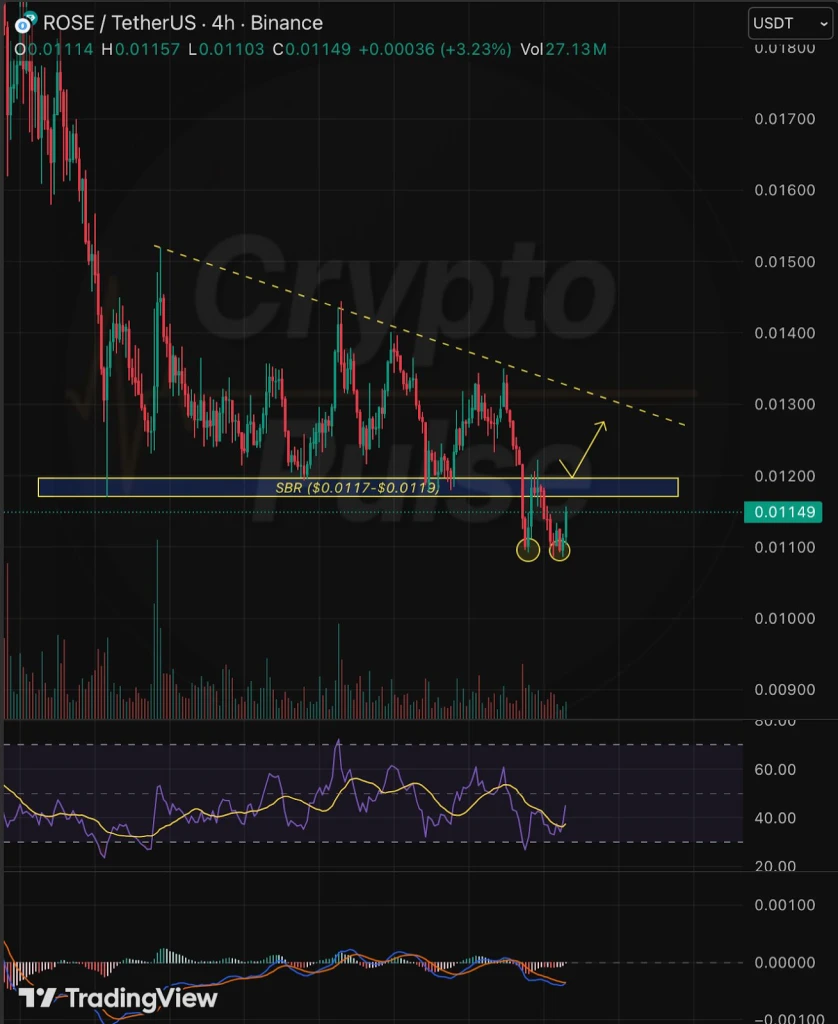
Oasis Network (ROSE) recently dropped below a key support level on the 4-hour chart, sparking concerns of a bearish trend continuation.
The crypto analyst, Crypto Pulse, highlighted that the price struggled to move further down, suggesting the breakdown may have been fake. Traders now watch closely as the crypto consolidates, hinting that a bullish reversal could be forming.
Technical analysis shows ROSE potentially forming a double bottom, a classic reversal pattern signaling a shift from bearish to bullish momentum.
The SBR (Support-Become-Resistance) level serves as the neckline, with a breakout above it likely confirming the pattern. A confirmed breakout may encourage momentum traders to enter, expecting price movement toward higher levels.
Also Read: Pyth Network (PYTH) Nears Breakout With Targets Set At $0.07–$0.18
ROSE Eye $0.013 as RSI & MACD Signal Momentum
Key technical indicators support the emerging bullish scenario. The RSI golden cross near 50 suggests buyers are gaining strength, while the MACD turning upward confirms rising buying pressure.
Combined, these indicators signal early momentum building, which could attract short-term traders looking for an entry point ahead of a potential upward move.
Source: Crypto Pulse X Post
In the event that the bullish momentum continues, the ROSE token might target a price of $0.013. It should be noted that the crypto space is highly volatile.
As such, confirmation of the double bottom and volume spike pattern should be taken into account. Caution should be taken by traders.
ROSE Technical Outlook Points to Improving Momentum
According to TradingView, as of Monday, March 2, ROSE shows a strong bearish trend as the prices are significantly low compared to the 20, 50, 100, and 200-period EMAs.
This indicates strong bearish action over the last days of February. The prices are currently ranging close to $0.01178, unable to break through the resistance provided by the descending moving average cluster and the upper Bollinger Band.

Source: TradingView
A minor relief rally is evident as the price reacts from the lower Bollinger Band at the $0.01071 level. However, this is not an indication of a stable market since the Bollinger Bands are moving further apart.
For the market to change its current momentum, ROSE needs to break past the $0.01211 level significantly. Until that happens, the market structure remains bearish.
Also Read: Oasis ROSE Set to Surge to $0.0238: Key Price Targets Revealed!