Image default
Analytic

SEC ETF Clock Ticks as Grayscale Shifts Benc…


The U.S. SEC’s new “generic listing standards” for commodity ETPs, approved on Sept. 18, set the backdrop for October crypto-ETF decisions across exchanges. These standards streamline how exchanges list certain commodity funds and have fueled expectations for more crypto ETFs to clear in October.

However, separate spot-Litecoin proposals still face their own clocks. Several trackers and outlets today reiterated October decision windows for altcoin ETFs, including Litecoin, under existing-rule filings. These roundups frame October as a month of final rulings for multiple non-BTC, non-ETH products.

Moreover, reporting over the weekend flagged that the SEC did not act by an early-October deadline on Canary’s spot Litecoin ETF submission amid broader operational uncertainty. That left the application pending going into this week.

Canary Litecoin ETF Delay. Source: Coinpaper on X

Grayscale Litecoin Trust changes its benchmark

Grayscale disclosed a benchmark change for Grayscale Litecoin Trust (LTCN). As of Oct. 1, the trust calculates NAV using the CoinDesk LTC CCIXber Reference Rate instead of the prior CoinDesk Litecoin Index (LTX). The shift appears in the trust’s Form 8-K filed with the SEC.

Grayscale Litecoin Trust Form 8K. Source: SEC

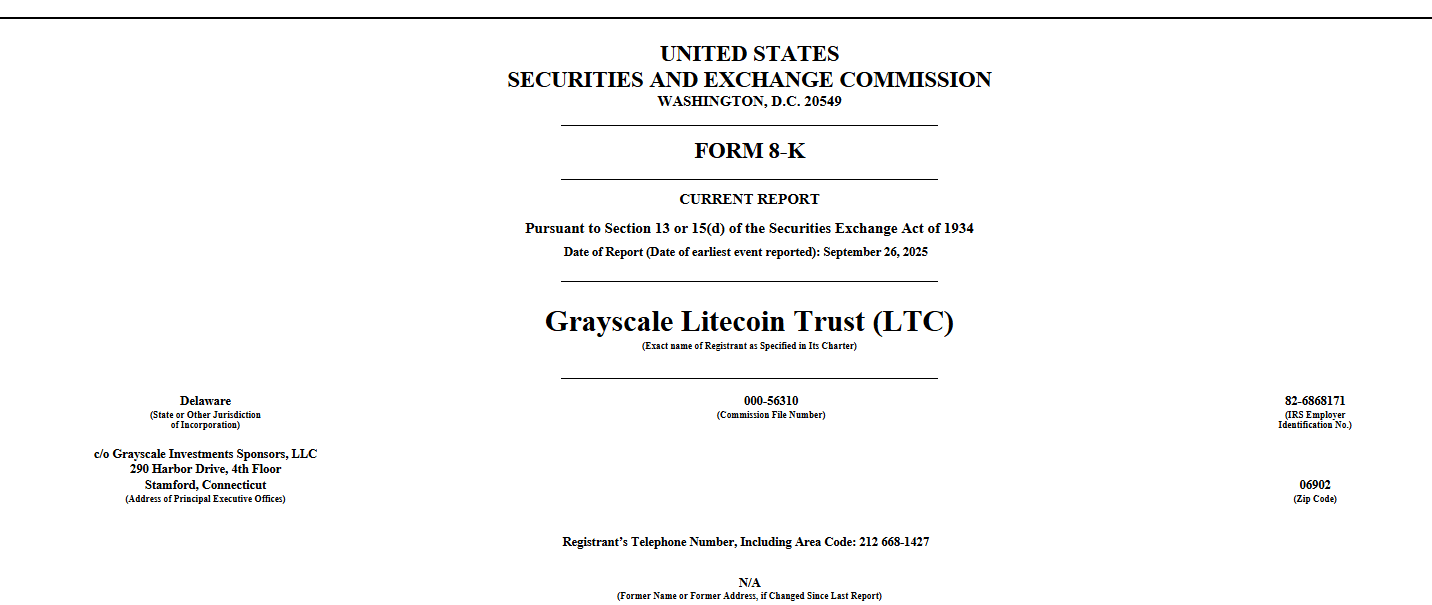
The filing states that, from Oct. 1 onward, both the Index and the NAV per share reference the CCIXber rate. This is an operational change to valuation inputs; it does not alter the trust’s stated investment objective.

Grayscale’s fund page also reflects the new reference rate effective Oct. 1, aligning public-facing materials with the SEC disclosure. This ensures investors see consistent NAV methodology across documents.

Merchant payments data places Litecoin near the top

CoinGate’s multi-year payments study shows Litecoin’s growing role in retail crypto payments. From January to August 2025, LTC accounted for about 13.9% of orders on the platform, ranking behind Bitcoin and USDT over that period.

The seven-year Litecoin report, published Sept. 18, details usage since LTC’s 2018 integration. It highlights persistent year-over-year growth and periods in mid-2025 when Litecoin briefly overtook USDT on the platform.

CoinGate’s broader 2025 trends note a steady climb in Litecoin’s share from 2023 through 2025. Taken together, these datasets frame Litecoin as one of the most used networks for merchant payments in 2025.

Privacy-focused “LIT” wallet initiative stays in view

The Litecoin Foundation and AmericanFortress announced a Litecoin-native “LIT” wallet in September with a focus on privacy. Materials describe integrations such as MWEB, FortressNames, and client-side filtering to minimize metadata exposure.

American Fortress Litecoin Wallet Announcement. Source: Litecoin Foundation on X

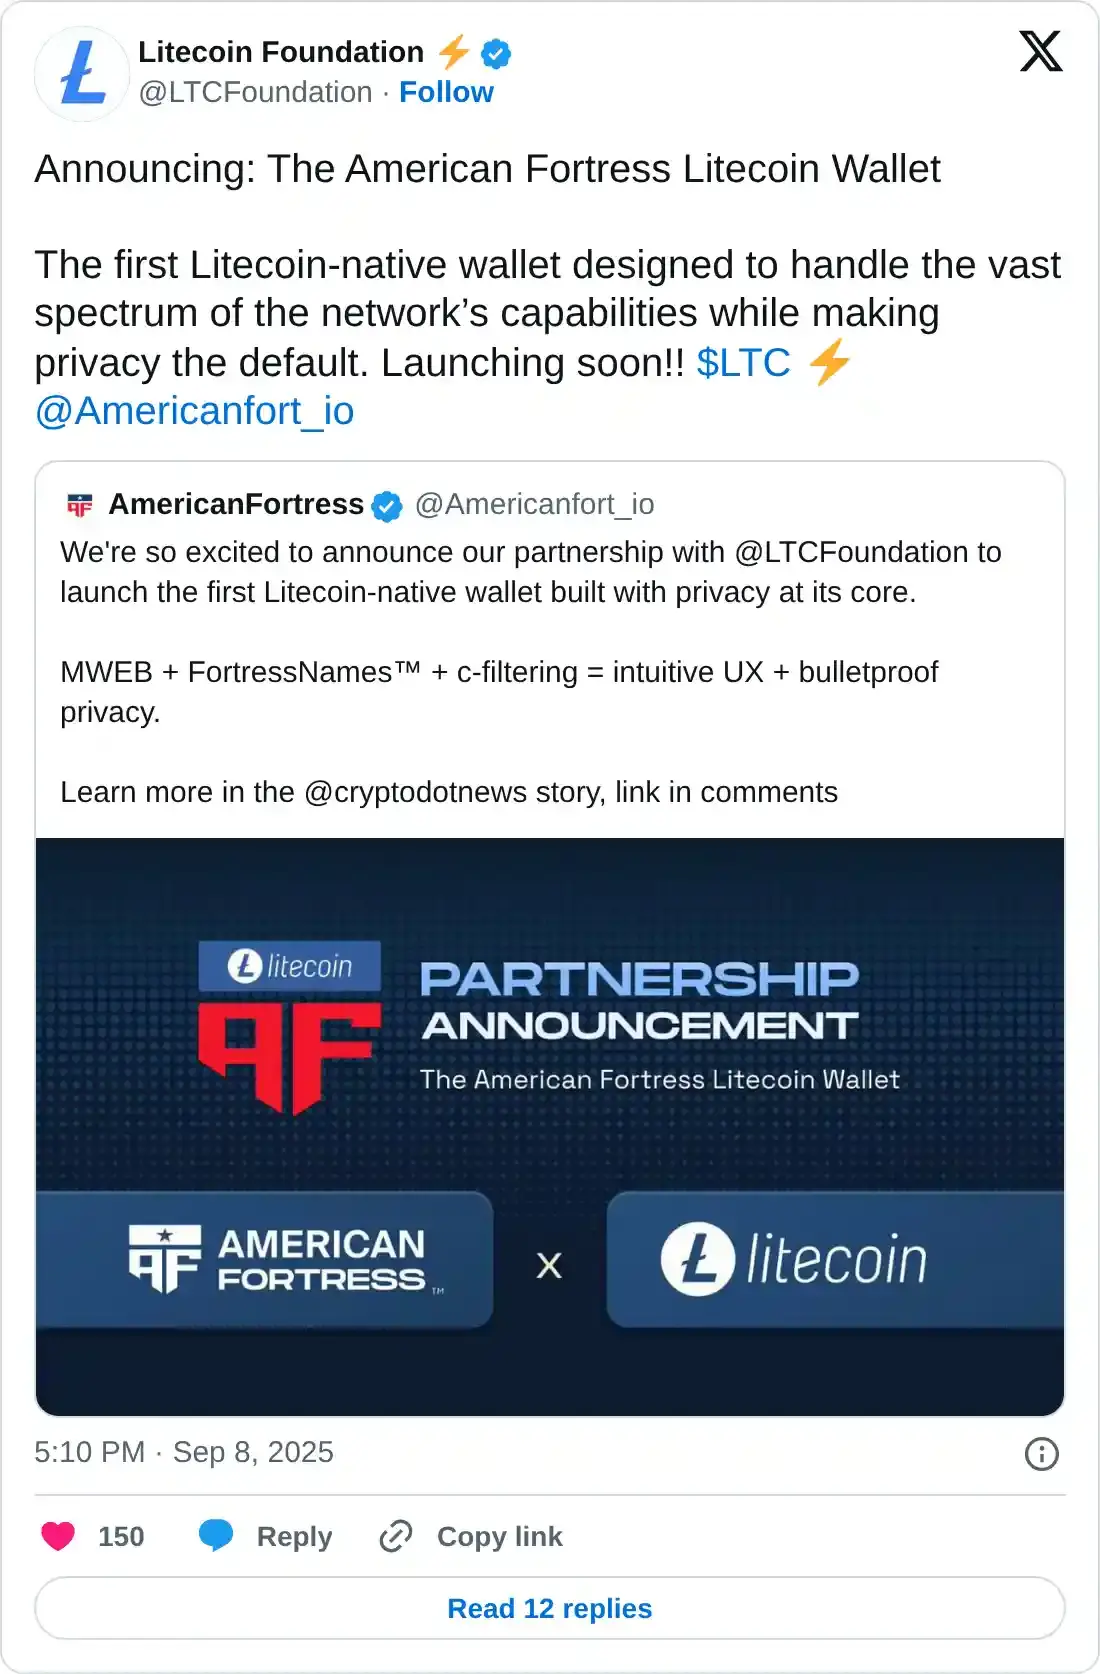
Coverage throughout September emphasized that the wallet aims to make MWEB features more accessible to everyday users. The update positioned privacy as a practical default rather than an advanced opt-in.

As of today, no fresh features were posted this week, but the wallet remains one of the network’s active non-price developments as October event windows approach. Reports continue to reference the rollout when summarizing Litecoin’s ecosystem updates.

Analyst flags intraday bullish setup for Litecoin

Trader Naman posted a chart that maps an intraday rounded-base and a planned long entry on a retest of a highlighted green zone. He states that bulls must first confirm a “strong rejection” there before momentum can continue. The LTC/USD  chart overlays a projected stair-step path higher once confirmation appears.

Litecoin Bullish Setup Chart. Source: Trader Naman on X

Moreover, the setup marks nearby invalidation below the recent intraday lows while keeping the focus on successive higher lows along the curve. The visual plan shows buyers defending the former breakout band, then reclaiming short-term resistance. Consequently, the path sketches a continuation sequence if the reaction at support holds.

Finally, the illustration places emphasis on reaction, not prediction. It shows the trigger, the invalidation, and the anticipated impulse only after confirmation. Therefore, the post frames the scenario as conditional on price behavior at the green zone rather than a standing call.

Analyst outlines impulsive move and conditional pullback for Litecoin

CryptoWaveV states that Litecoin is printing an impulsive advance on the 4-hour chart. He counts five waves into recent highs, which signals trend strength rather than chop. He adds that volume expanded on upswings while moving averages turned upward, which supports the impulse view.

Litecoin Impulse and Pullback Roadmap. Source: CryptoWaveV on X

Next, he flags a possible local top. If price stalls here, he expects a corrective pullback to unfold in an A-B-C style. He places the likely retrace area near prior demand where buyers stepped in late September and early October. He treats that zone as the place to test whether the trend remains intact.

Then, he defines the plan. He wants price to dip into that demand, set a higher low, and show a clear reaction with rising volume. If those steps appear, he anticipates the next leg of the impulse to resume. If price loses the demand block and closes below September’s base, he marks the setup invalid and stands aside.

Finally, he emphasizes structure over prediction. He focuses on three checks: the location of the pullback, the quality of the bounce, and the preservation of higher lows. He notes that the moving averages now slope upward, so he uses them as dynamic support during any retrace. He keeps the roadmap conditional on confirmation rather than a pre-set call.

RSI momentum shifts above neutral zone

Litecoin’s daily Relative Strength Index (RSI 14) stands at 61.56, climbing above the neutral 50 mark after a period of weakness in September. The indicator crossed over its signal line in late September, confirming a change in short-term momentum. Historically, similar shifts from sub-40 to above 60 have preceded extended rallies earlier in the year, such as in February and late May.

Litecoin RSI 14 Daily Chart. Source: TradingView

The current structure shows a steady upward slope in the RSI with no overbought conditions yet. The last time RSI pushed into the 70–75 range was in July, which marked a temporary top before a multi-week decline. The absence of sharp spikes now suggests that momentum is building gradually rather than peaking abruptly.

The signal line remains below the RSI, supporting the bullish crossover. If RSI continues its climb toward the 70 zone without major divergences, it could indicate sustained buying pressure. A failure to hold above 50, however, would signal weakening momentum and potential range-bound movement.


Source link

Related posts

Zebec’s Compliance Push and ZBCN Breakout? SOC 2 Done, MiCA Next, …

Tokenaltcoin

REX files DOJE income ETF, Tidal plans 2X Alt Season ETFs

Tokenaltcoin

XRP Seoul 2025 Unveils ‘Infinite Money Glitch’ Crypto Founder Says, ‘This Is a Dream Come True’

Tokenaltcoin