
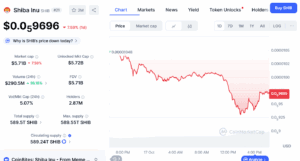
Shiba Inu (SHIB) fell 7 % in a single day as the crypto market faced heavy liquidations worth more than $1.2 billion. The selloff began when Bitcoin (BTC) slipped over 6% and reached $104,000. The move came amid renewed anxiety over U.S. regional bank stability and broader risk aversion in global markets, pushing investors away from volatile assets like crypto.
Now, the question is — what’s next for SHIB? Is the downturn over, or is this just another setup for a deeper dip? Let’s analyze.
SHIB Price Breaks Support as Selling Deepens
TradingView data shows SHIB dropped to around $0.0000097, breaking below the $0.000010 support zone that had held since mid-August. The daily chart confirms a bearish continuation pattern after the token failed to sustain momentum above $0.000012 earlier this month.
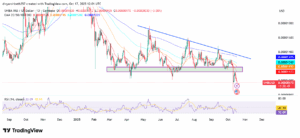
The RSI near 33 shows oversold conditions, but the absence of strong buying volume suggests the market isn’t ready to reverse yet. SHIB price now faces resistance at $0.000011, while the next major support lies around $0.0000085. A decisive drop below that could extend losses toward $0.0000078, last seen in early July.
Your Open Interest (OI) chart shows SHIB futures positions falling from $120 million to $95 million during the sell-off.
A fall in both OI and price means traders are closing positions instead of adding new shorts. This pattern shows forced liquidations and position exits, not fresh bearish bets.
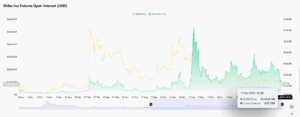
Funding data supports the same view. The funding rate turned negative at –0.007 %, showing that short positions now outweigh longs. When OI falls and funding turns negative together, it usually means leverage is being cleared out of the system — a sign that panic is high and liquidity is thin.
Is This a “Buy the Dip” Opportunity or Will It Go Down Further?
SHIB’s price chart remains bearish. The token trades well below its 20-, 50-, and 100-day averages, and momentum indicators show limited buying pressure. If the token holds above $0.0000090, it may stabilize and retest $0.0000108–$0.0000110 in the short term. Failure to defend that level could extend the slide to $0.0000085 or even $0.0000078 if Bitcoin weakens further.
Bitcoin’s next move will likely decide the outcome. A recovery above $110,000 could pull Shiba Inu higher, while continued stress below $108,000 would keep pressure on memecoins.
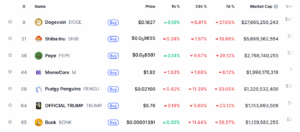
The selloff wasn’t limited to SHIB. The memecoin market capitalization dropped 8 % in 24 hours to about $52.9 billion. Dogecoin (DOGE) and PEPE also slid between 8–9 %.
This synchronized decline shows the downturn is sector-wide, not driven by SHIB alone. During risk-off phases, traders usually rotate out of speculative tokens first, making memecoins the earliest casualties of broader liquidations.