Some coins have returned to the green zone, while the prices of others keep falling, according to CoinStats.
SOL/USD
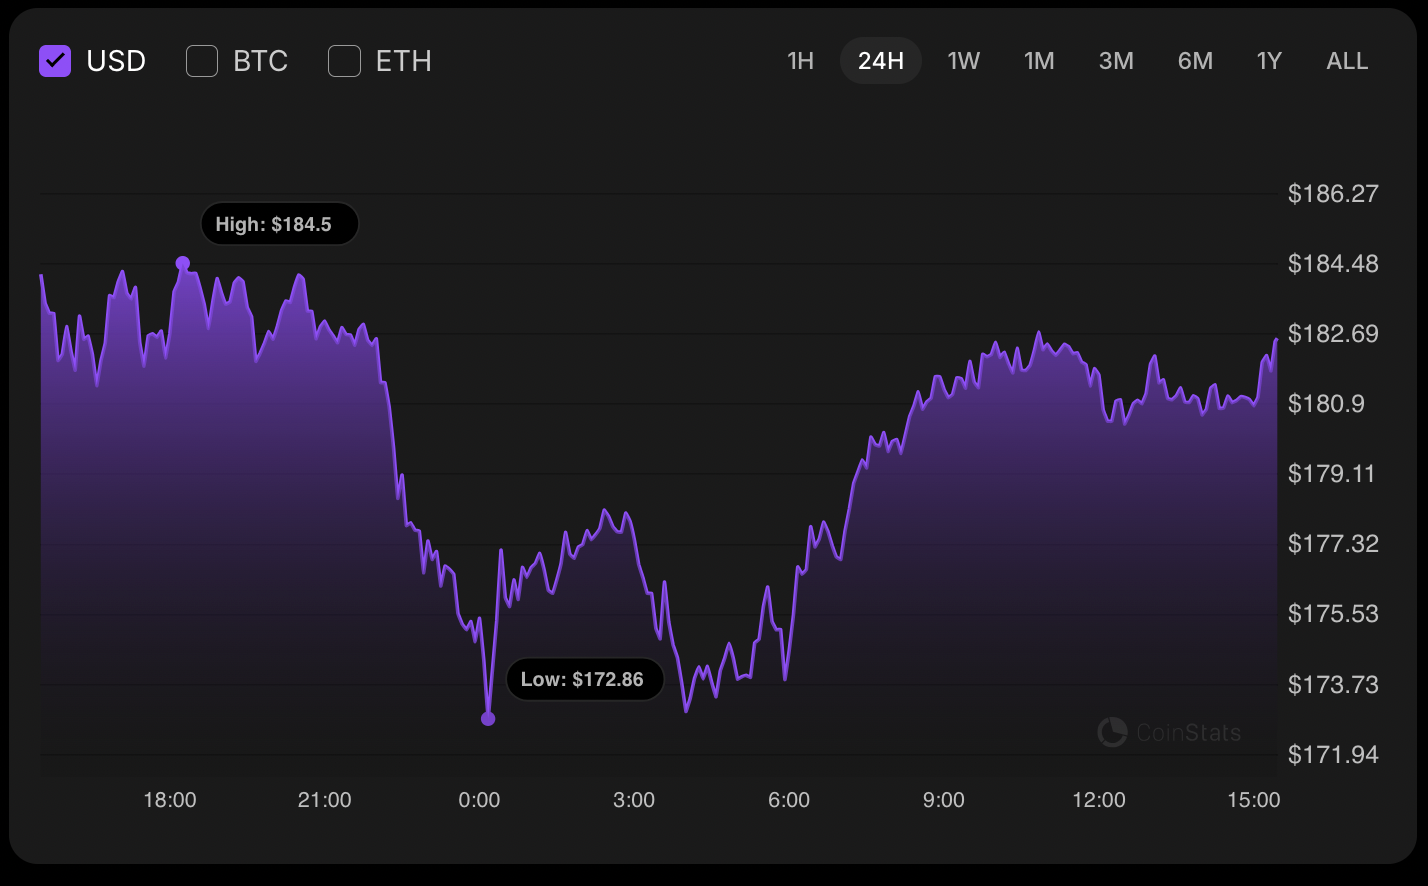
The rate of Solana (SOL) has remained the same since yesterday. Over the last week, the price has fallen by 21%.
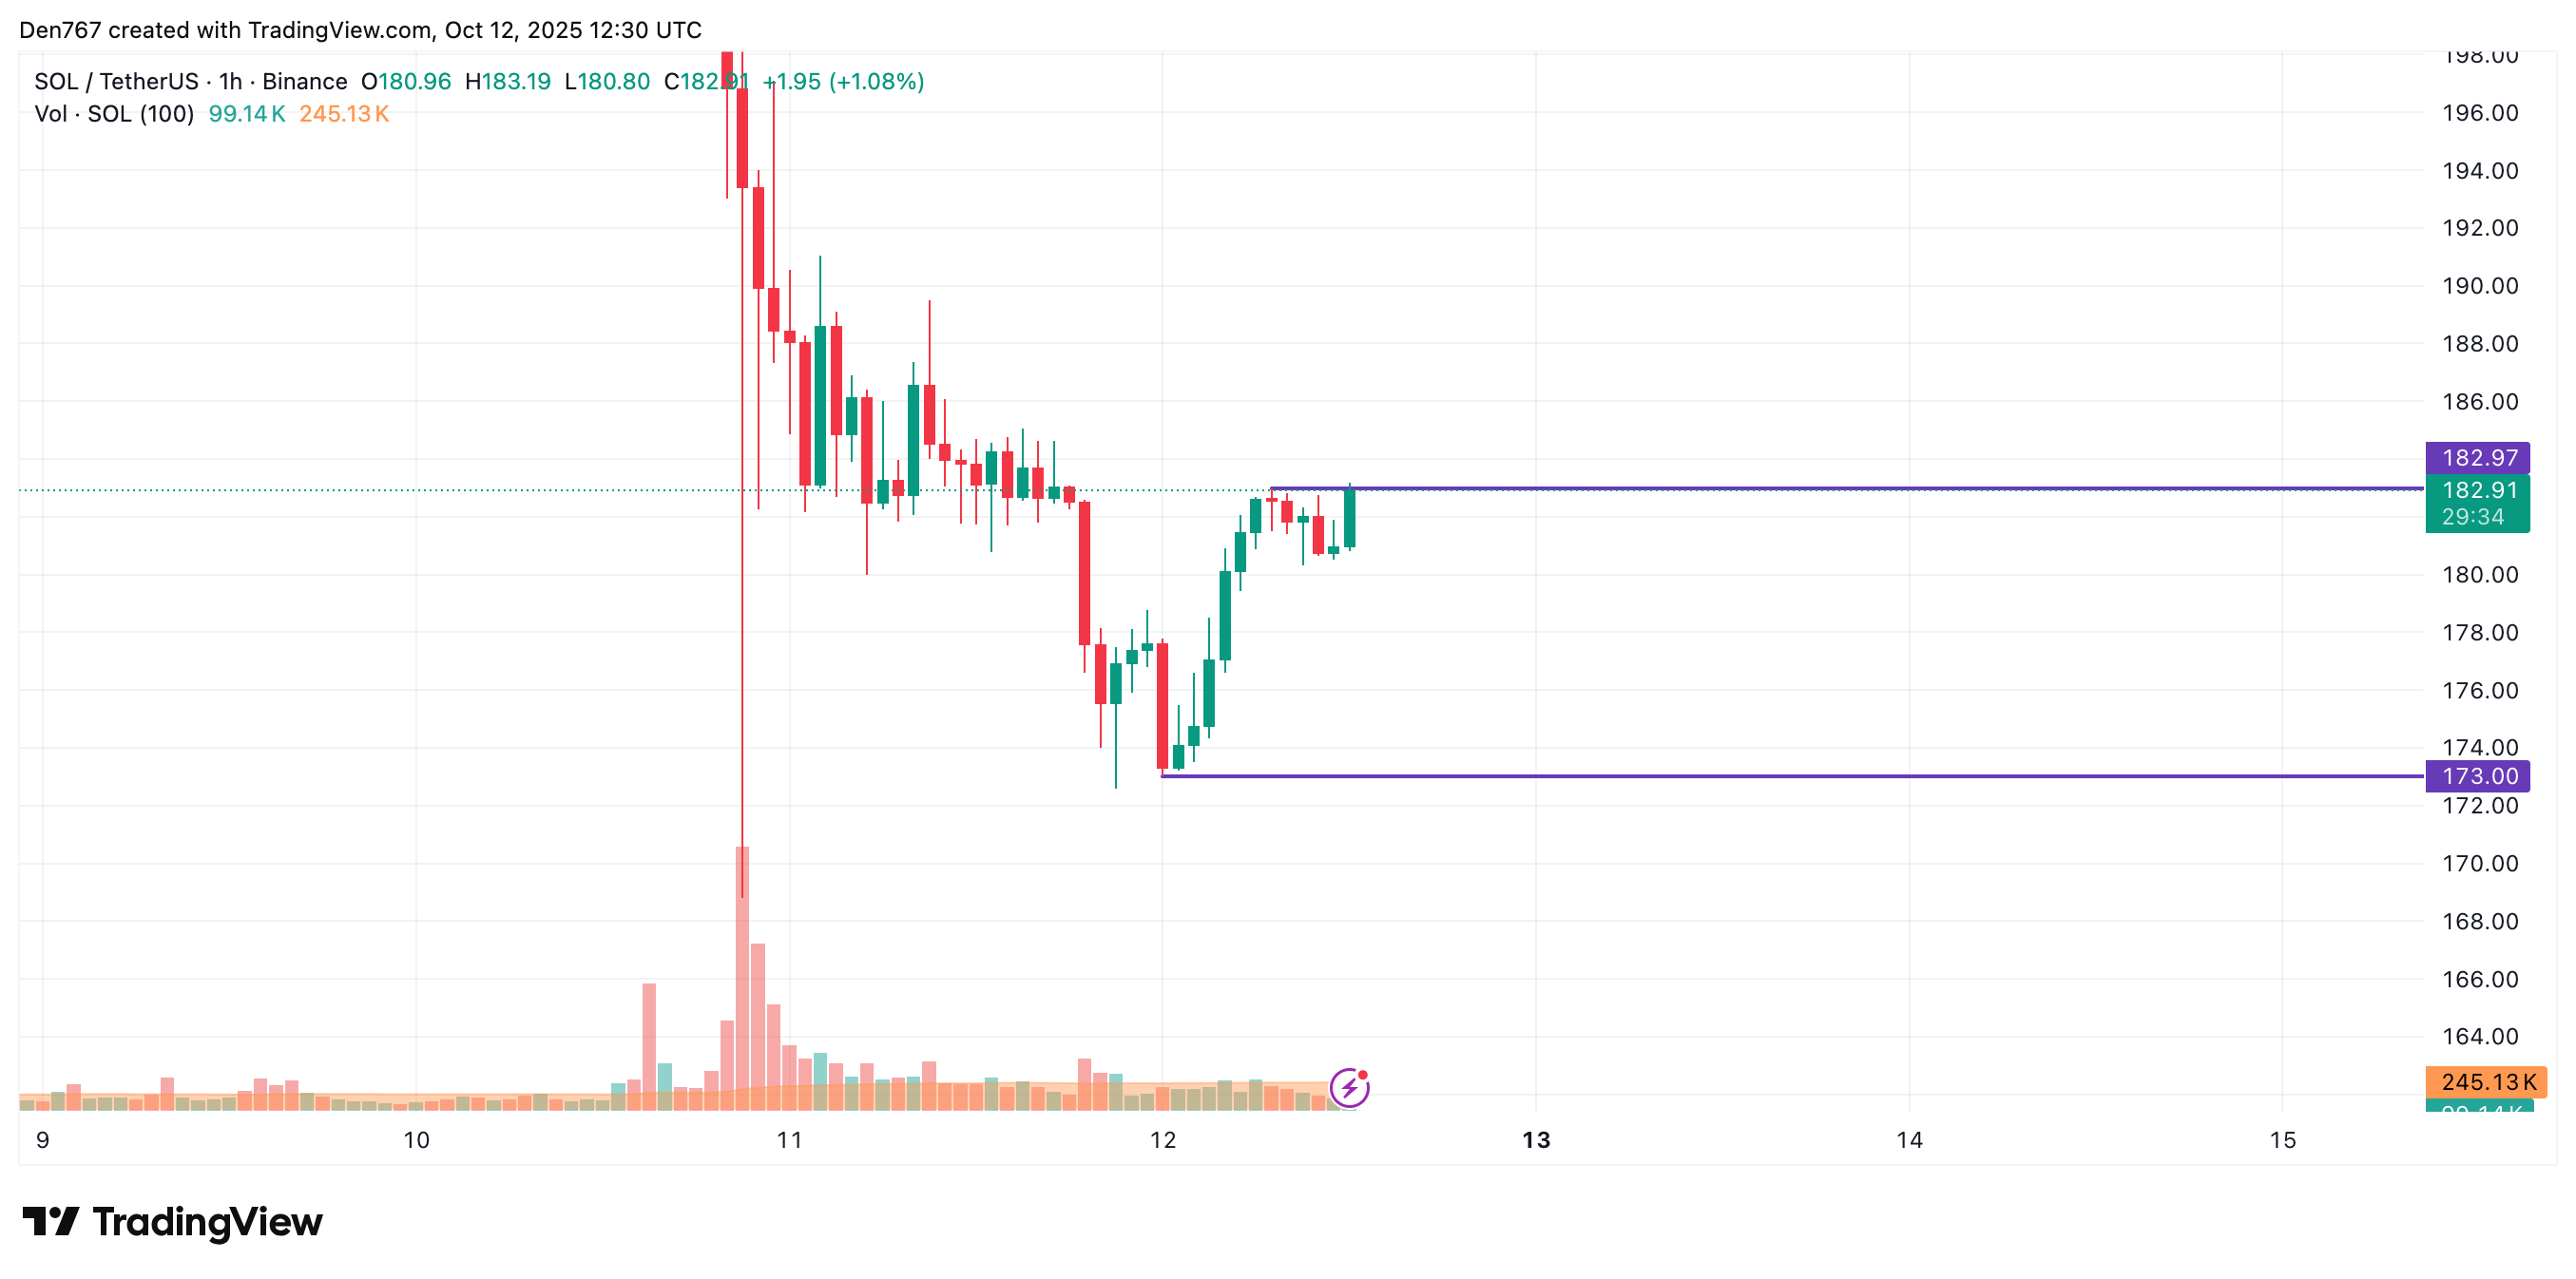
On the hourly chart, the price of SOL is about to break the local resistance of $182.97. If that happens, the upward move is likely to continue to the $190 mark.
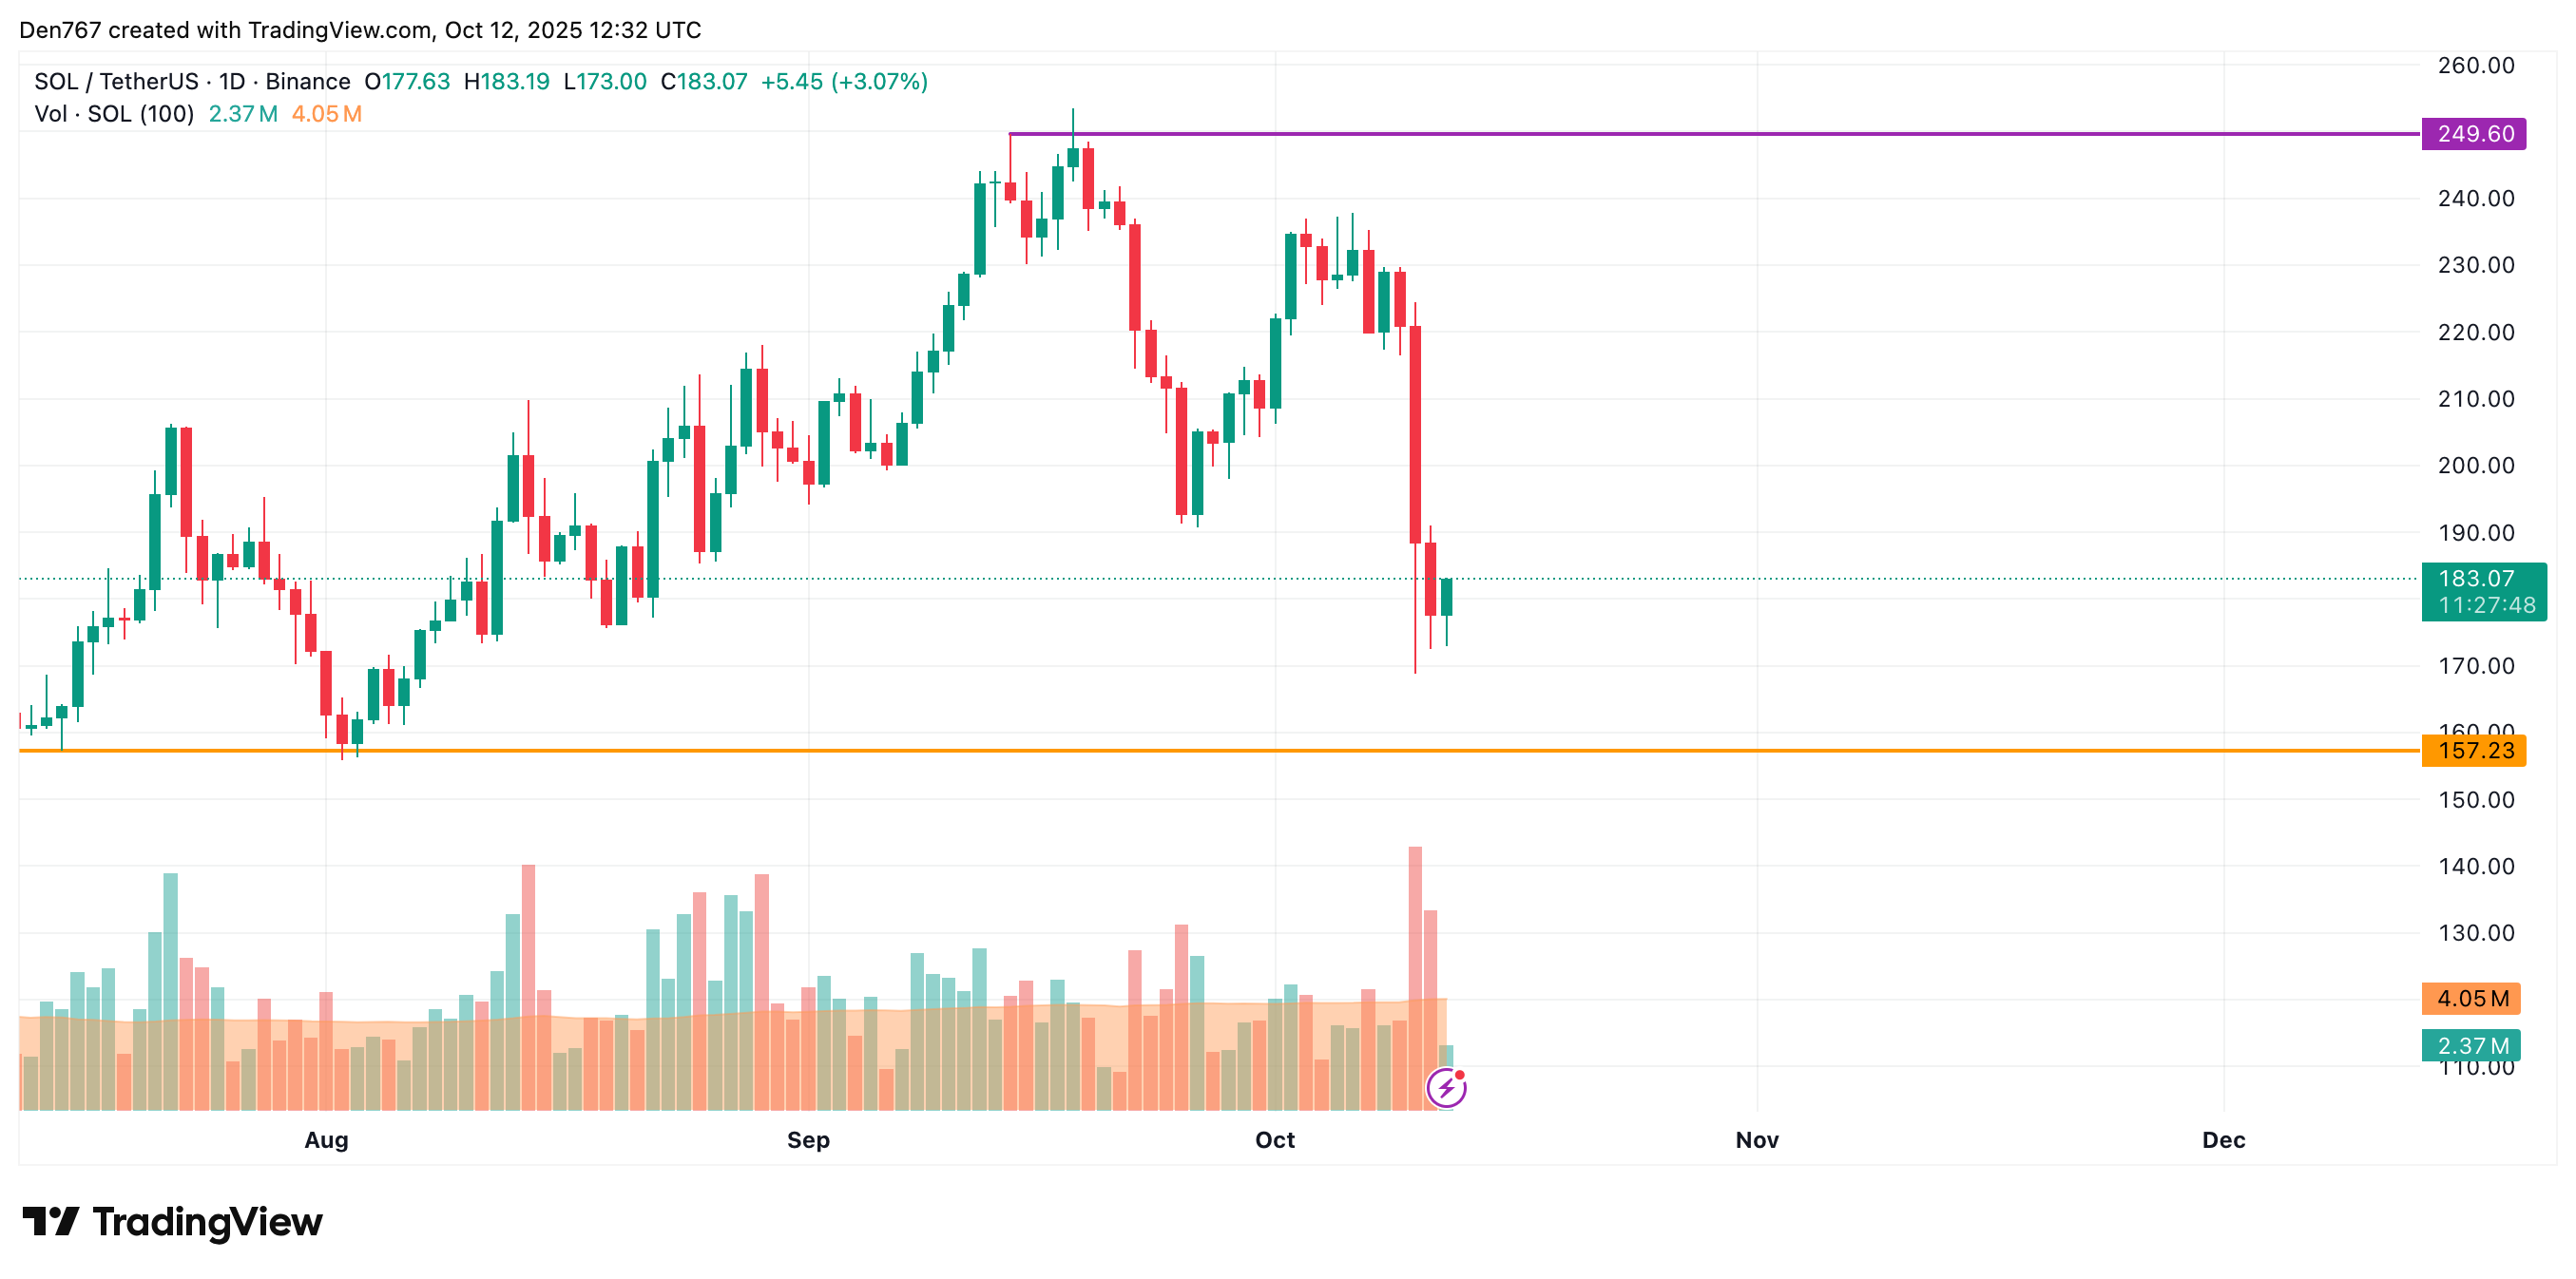
On the bigger time frame, neither side is dominating as the rate is far from the main levels. The volume is going down, confirming the absence of bulls’ or bears’ strength.
You Might Also Like

In this regard, sideways trading in the range of $175-$190 is the more likely scenario.
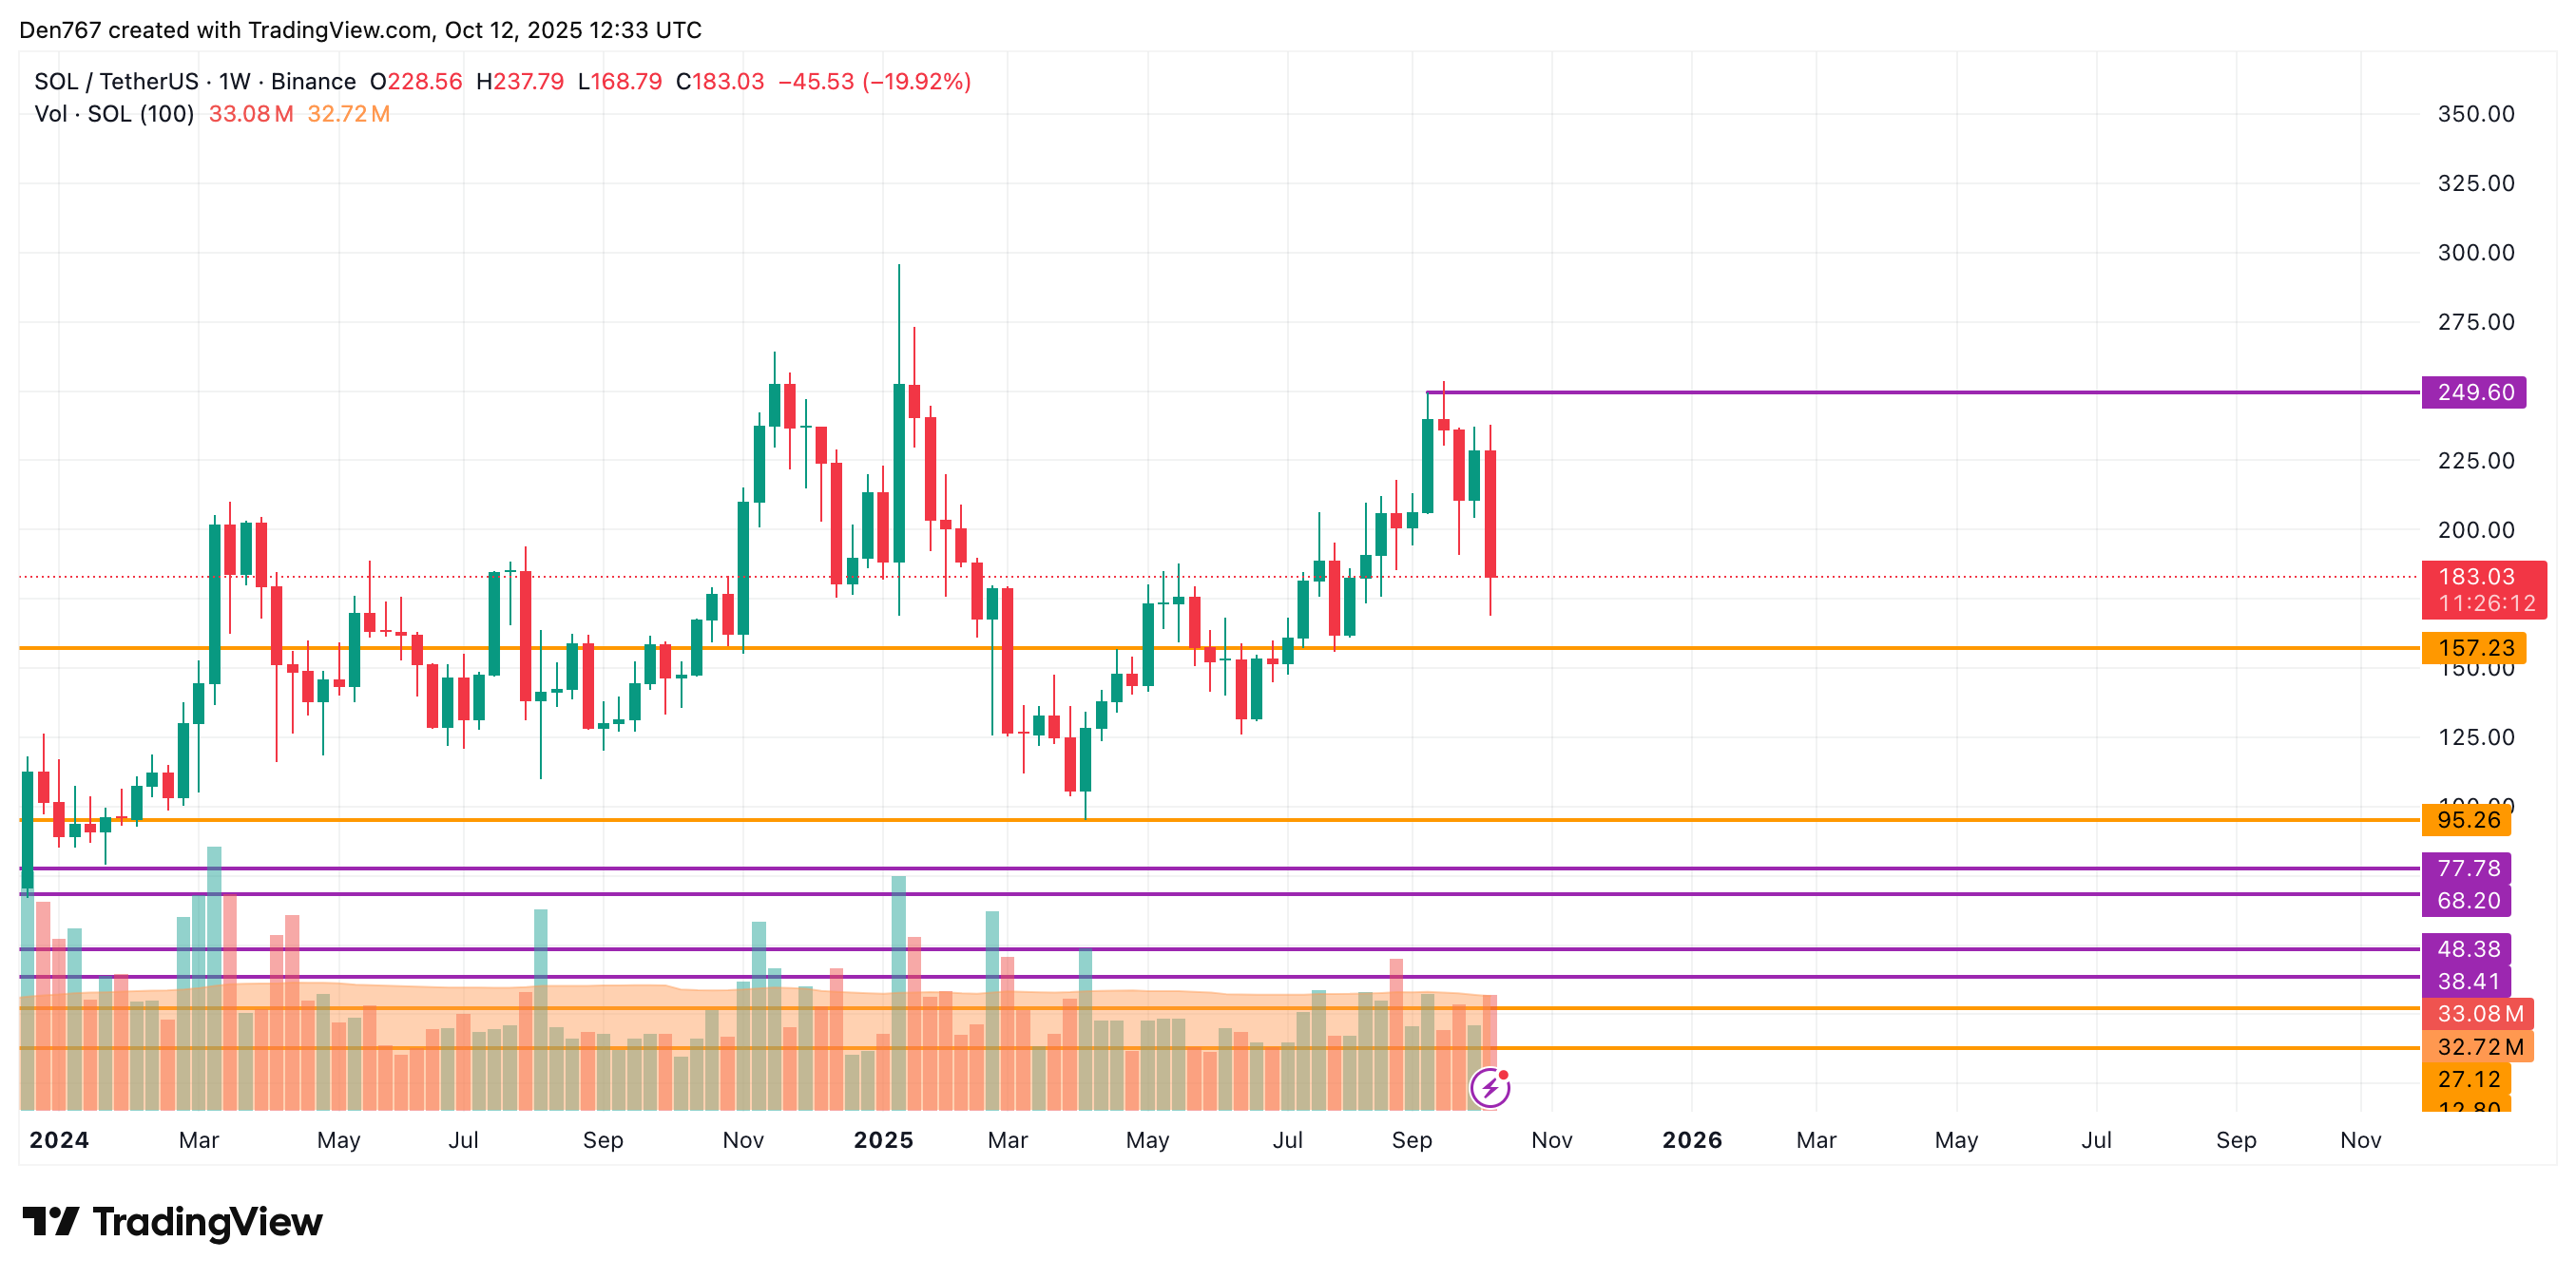
From the midterm point of view, sellers are more powerful than buyers. If the weekly candle closes around the current prices or below, the correction is likely to continue to the support of $157 the upcoming week.
SOL is trading at $183 at press time.