

Solana (SOL) dipped by over 6%, due to the overall crypto market decline, causing the asset to test a significant support level that investors focus on. The SOL is likely to experience a potential reversal based on the overall technical indicators.
At the time of writing, Solana (SOL) is trading at $84.52, with a 24-hour trading volume of $7.30 billion and a market capitalization of $48.21 billion, according to market data from CoinMarketCap. Over the last 24 hours, the price has declined by 6%.

Source: CoinMarketCap
Solana Stabilizes Above Critical Support Zone
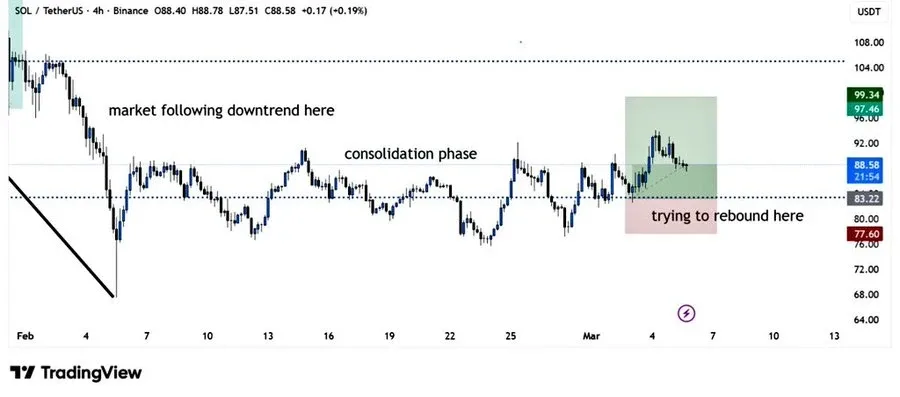
Crypto analyst BitGuru highlighted that Solana is trying to stabilize after a run of price declines and consolidation. BitGuru also pointed out the price range of $80-$83 as an important price zone for market players to watch.
Source: X
This level has increasingly become a key level for buyers. If the price is able to stay above this zone, it could mean that the short-term setup of the recovery pattern remains intact. Further upward movement could mean that the price targets the next resistance zone at $97-$100, which could be a major technical hurdle for the asset.
However, if Solana fails to hold the current support zone, the strength of the recovery attempt could weaken, which may extend the decline, increasing the short-term selling pressure.
Solana Remains Below Key Averages
Technical indicators indicate that Solana is under pressure despite the initial momentum stabilizing. The current price is around $84.45, close to the 20-day simple moving average, which is around $84.62.
The Relative Strength Index (RSI) stands at 44.51, slightly higher than its signal line at 42.76. Momentum appears to rise gradually, but the RSI remains below the threshold of 50, indicating a cautious buying pattern.

Source: TradingView
SOL is still in a weak position, trading below its key moving averages. 50-day SMA: $99.20, 100-day SMA: $115.72, 200-day SMA: $154.35.
Also Read | Bitcoin’s Relief Rally Suddenly Crumbles Under $228M ETF Outflow Pressure
Solana MACD Signals Possible Shift
Another indication of a possible shift in short-term momentum is the Moving Average Convergence Divergence (MACD) indicator. The histogram has been in positive territory lately, registering at 1.6769. The MACD line is -2.5281, which is still lower than the signal line -4.2050. This means that the recovery signal is not yet confirmed.
If the buying pressure continues and SOL is able to hold its support, a short-term price increase may be observed in the coming sessions. Currently, the levels of support and resistance to watch are $80-$83 and $97-$100, respectively.
Also Read | Toncoin (TON) Eyes Powerful 29% Jump Despite Bearish Signals