
Fitell Corporation announced a Solana (SOL) digital-asset treasury supported by an up to $100 million convertible note facility. The company said it aims to generate yield across decentralized finance strategies. It described the plan as focused on staking and derivatives.
Fitell stated it will initially deploy $10 million from the first closing to purchase SOL. The firm paired the rollout with new DeFi hires to oversee execution. Management framed the approach as a structured treasury strategy.

The company shared timing and facility details across wire and market outlets. These releases position the move as an Australian-listed entrant to Solana treasuries. Disclosures emphasized yield and on-chain participation.
Brera pivots to “Solmate” with $300M to build a Solana treasury
Brera Holdings said it will rebrand to “Solmate” and adopt a Solana-focused treasury model. The company disclosed an oversubscribed $300 million private placement led by Pulsar Group, with participation from ARK Invest, RockawayX, and the Solana Foundation. It also plans a dual listing in the UAE.
Financial press reports noted sharp stock moves around the announcement window. Coverage highlighted the rebrand, the Solana accumulation plan, and investor lineup. Outlets also tracked trading volatility after the reveal.
Sector media summarized the pivot as a shift from a sports holding company to a Solana treasury and infrastructure venture. Brera said it will maintain existing club operations while executing the Solana plan. The firm outlined staking and ecosystem integration as next steps.
DFDV Korea: Solana digital asset treasury planned for South Korea
DeFi Development Corp. (DFDV) and Frametric Labs announced plans to launch “DFDV Korea,” described as South Korea’s first Solana Digital Asset Treasury. DFDV adopted a policy allocating its principal reserve to SOL and said it operates validator infrastructure. The company cited staking rewards and delegation fees as revenue streams.
A related filing outlined collaboration with ZeroStack and reiterated the Korean expansion. The company scheduled ecosystem briefings tied to the Treasury Accelerator model. It described equity and service-fee components for partners.
Secondary syndication repeated the Korea launch details and emphasized the SOL allocation. Coverage framed the step as a regional first for a listed U.S. company’s Solana treasury arm. The press noted the intent to provide investors direct exposure to SOL.
Infrastructure updates: Solana RPCv2 program and Agave client releases
The Solana Foundation announced RPCv2 RFPs and an RPC Working Group to coordinate providers and developers. The initiative organizes work across Accounts, Historical, and Streaming domains. The Foundation said it will fund teams and unify the read layer.
Community summaries added context on licensing and maintenance grants for selected teams. Posts noted an AGPL codebase and follow-up support for awardees. The aim is to improve reliability and transparency across the network’s read path.
On the node side, the Agave client posted recent stable releases suitable for Mainnet-Beta. Release notes confirmed builds now target Ubuntu 22.04 due to Ubuntu 20.04 reaching end of life, affecting binary compatibility. Operators were directed to updated deployment guidance.

Ali Martinez (@ali_charts) said Solana (SOL) “retested the $210 breakout zone” and is “preparing for the next leg up to $320.” He shared a TradingView daily chart of SOL/USDT Perpetual (Binance) dated Sep. 22, 2025, 15:08 UTC. The image shows price around $220.84 with session stats O 236.04 / H 236.87 / L 212.29 / C 220.84.
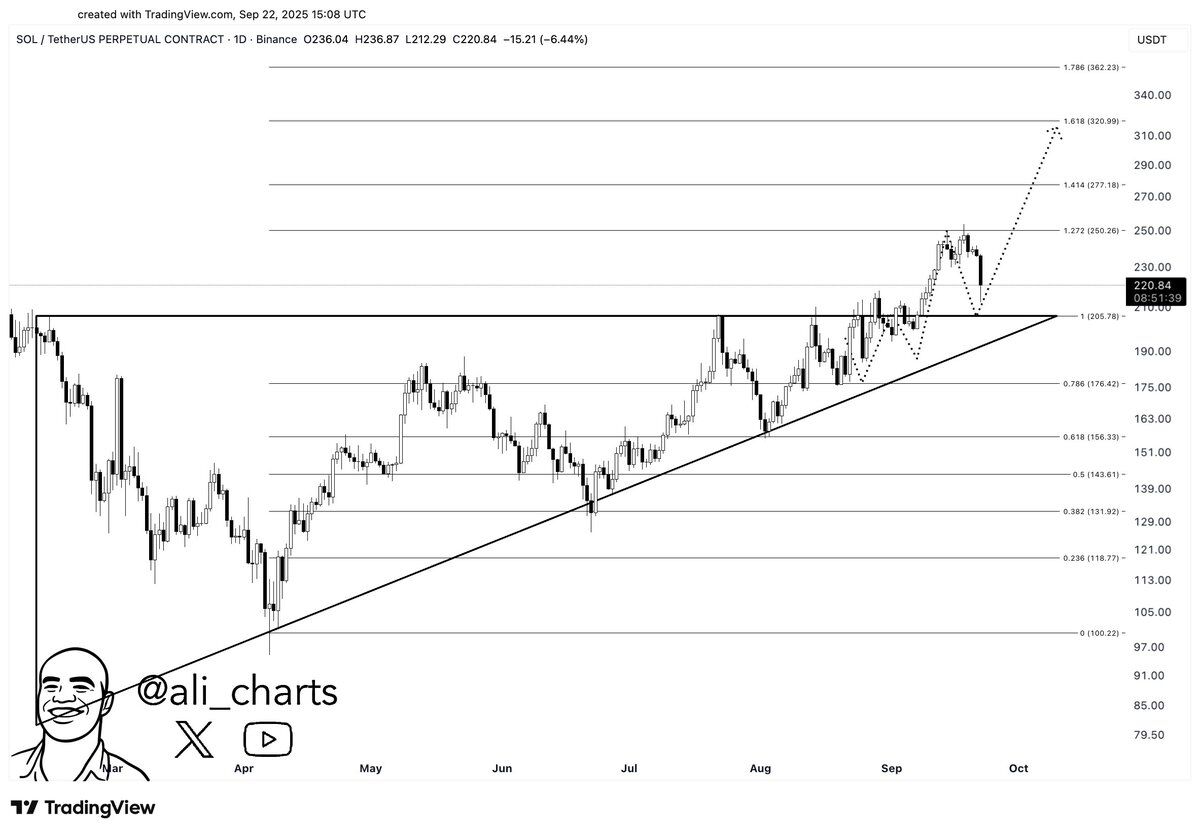
The chart plots a rising diagonal from the March–April lows into September, meeting a horizontal shelf near $205–$210. Thus, the prior range top now acts as support. Dotted paths illustrate a bounce from that shelf or a brief tag of the trendline before turning higher.
Fibonacci extensions label 1.272 ≈ $250.26, 1.414 ≈ $277.18, and 1.618 ≈ $320.99. Consequently, Martinez’s $320 target aligns with the 1.618 band on the graphic. The layout keeps $205–$210 as the decision zone, with extensions marking staged overhead levels.
Solana daily RSI signals momentum cool-off (TradingView)
The chart shows RSI (14) for Solana on the daily timeframe, time-stamped Sep 23, 2025, 18:00 UTC. The purple RSI reads 46.59, while the yellow signal line sits near 63.49. Standard guide rails appear at 70 (overbought) and 30 (oversold).
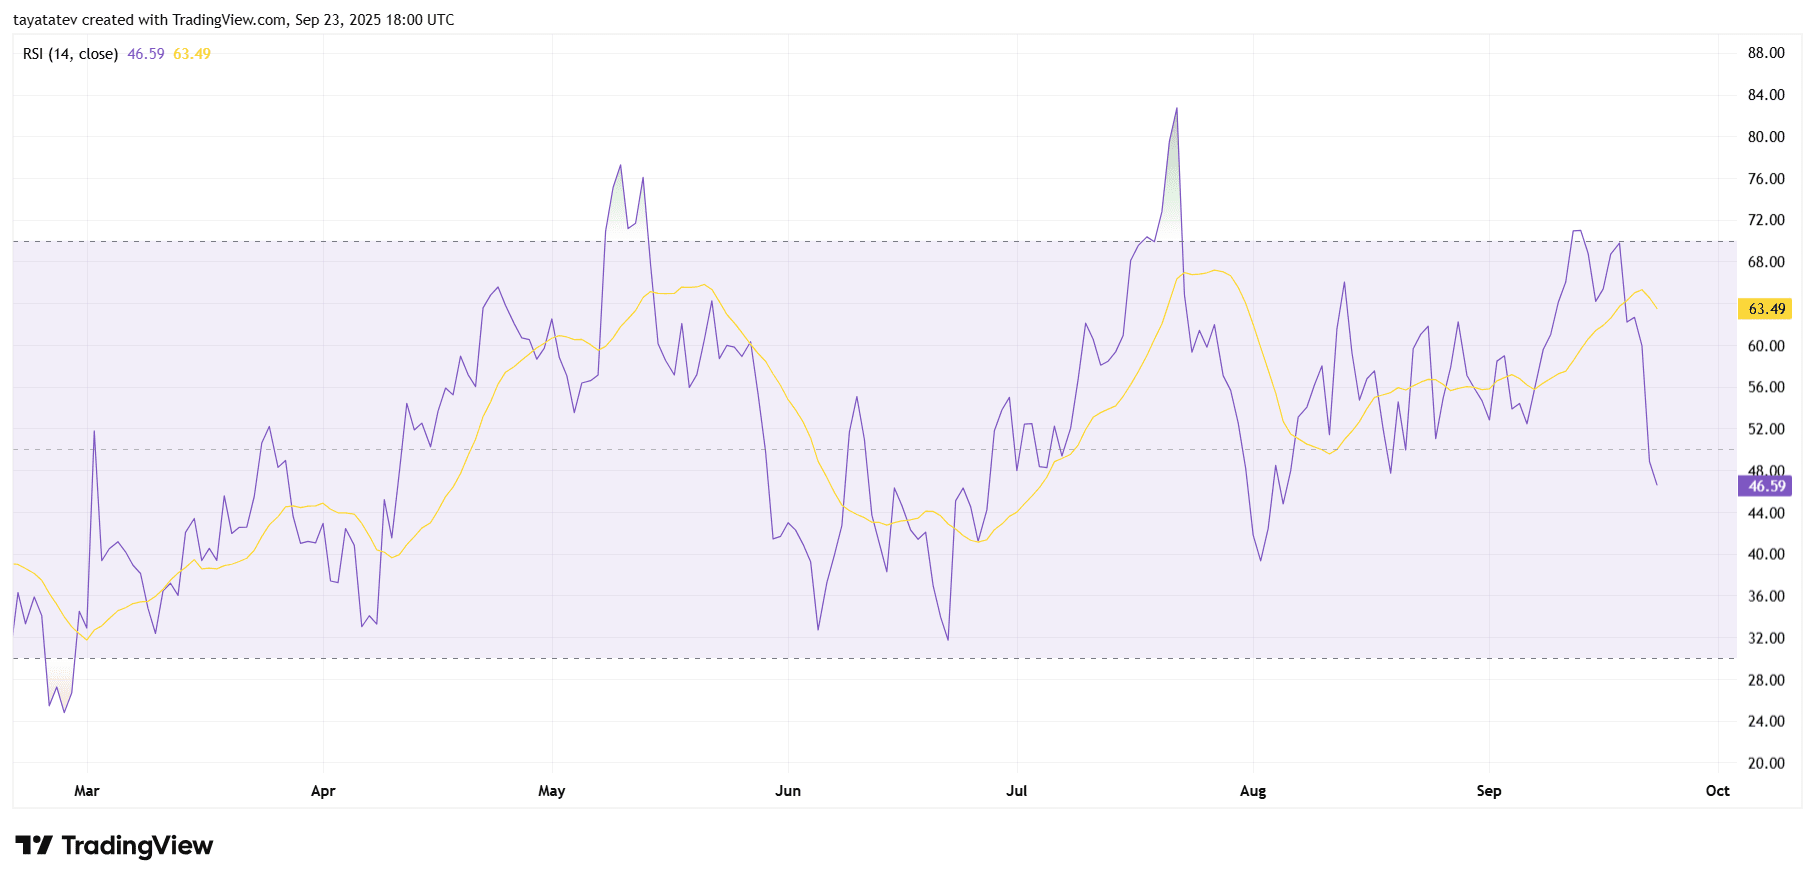
Momentum turned lower as the RSI fell below 50 and crossed under its signal line. That cross followed a brief push above 70 in late August, which marked short-term overheating. Since then, readings slipped into a neutral-to-soft zone, indicating sellers have the near-term initiative.
No clear bullish or bearish divergence is visible against recent price swings on this plot alone. However, the midline at 50 now acts as the first hurdle for any momentum rebound. A sustained hold above 50 would restore neutral footing; a drift toward 30 would reflect mounting downside pressure.
Solana daily MACD slips below signal, momentum turns negative
The MACD (12,26,close) for Solana on the daily chart shows the MACD line ~7.55 now below the signal line ~10.45, with the histogram at –2.89. The cross occurred after an early-September momentum peak near the mid-teens on the MACD line. Consequently, the histogram flipped from green to red and expanded, indicating building downside momentum.
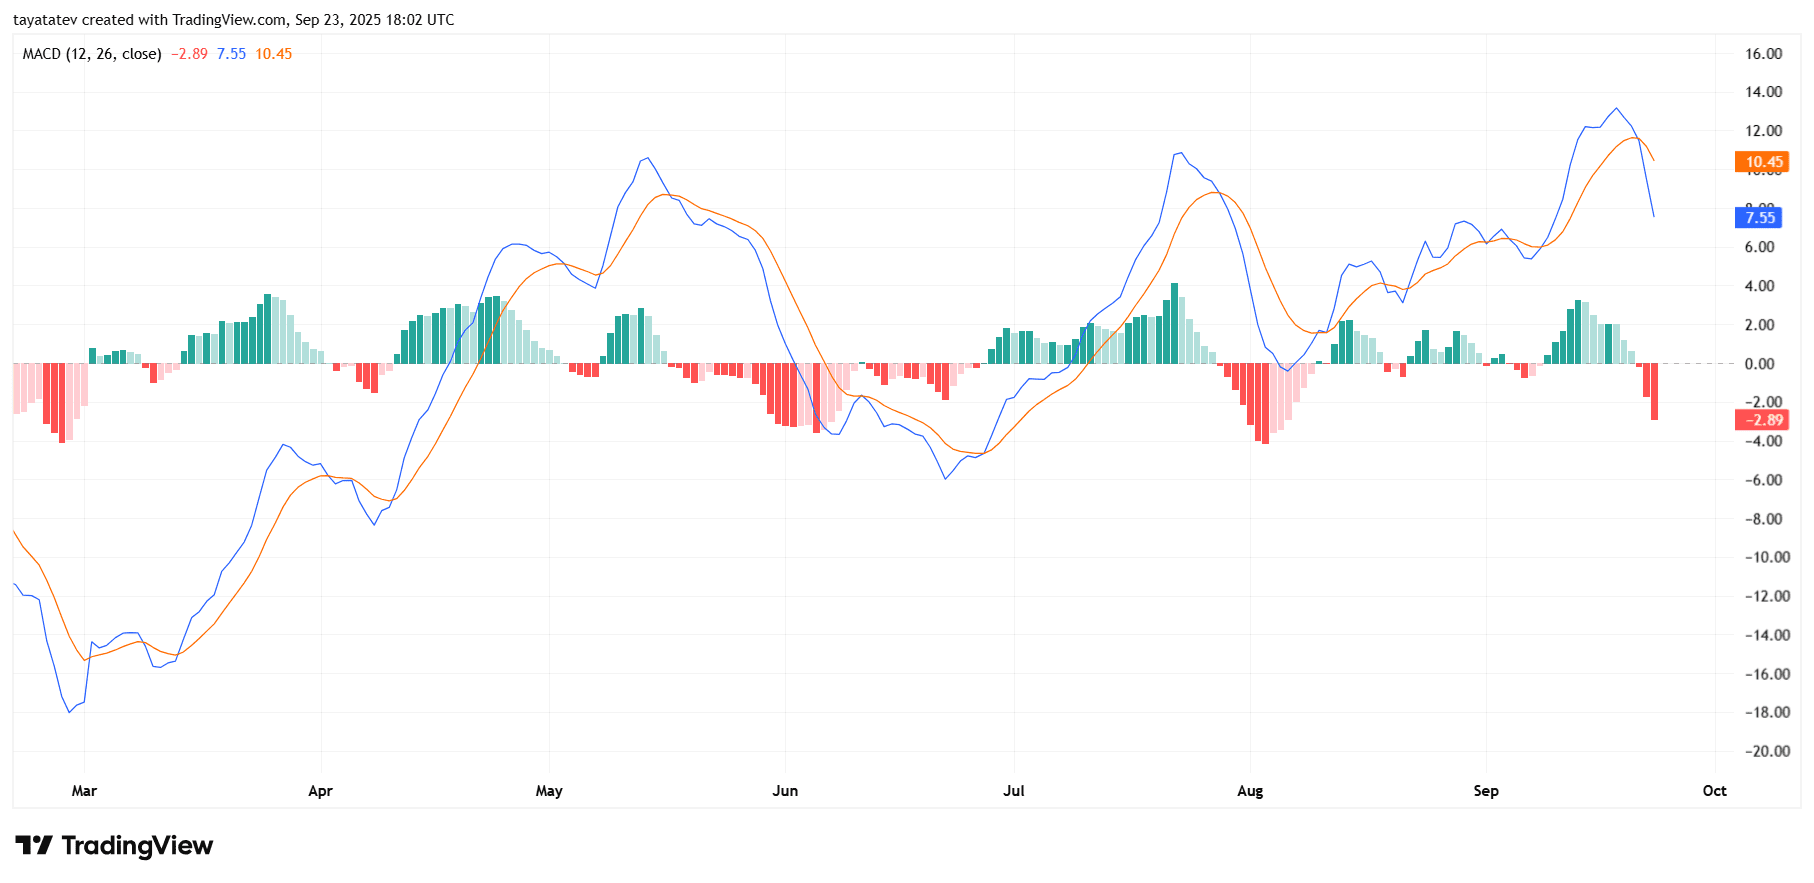
Recent bars illustrate a clean rollover: MACD rose through July and August, topped in early September, then curved down to meet and cross the signal. The histogram’s progression from light green to dark red confirms acceleration after the cross. This sequence mirrors prior swings on the chart, where crossovers preceded trend shifts in June and August.
The indicator now sits just below the zero axis, so the next reference is the zero-line test. A sustained stay below zero would reflect continued negative momentum; a quick reclaim would signal stabilization. Without price overlaid here, the MACD alone reports direction and speed of change, not support or resistance.