
The Federal Reserve opened its Payments Innovation Conference today with a panel on bridging traditional finance and the digital-asset stack that includes Chainlink co-founder Sergey Nazarov. The agenda lists opening remarks by Governor Christopher Waller and a one-hour discussion with executives from BNY, Lead Bank, and Fireblocks. The session sets a policy backdrop for stablecoins, tokenization, and interoperability in payment systems.

The conference date and lineup confirm formal engagement between policymakers and infrastructure builders. The Fed’s notice places crypto topics inside a broader payments modernization program rather than a trading event. Coverage ahead of the meeting underscored focus areas such as stablecoin use cases and tokenized assets.
Today’s agenda positions Chainlink in front of bank and market-infrastructure decision-makers. Therefore, the news centers on how regulated institutions could use on-chain data and messaging, not on price moves.
Fed forum: policy signals for stablecoins and tokenization
The Fed’s program begins with Waller’s remarks, followed by “Bridging traditional finance with the digital asset ecosystem,” moderated by Rebecca Rettig. Speakers include Sergey Nazarov (Chainlink), Jackie Reses (Lead Bank), Michael Shaulov (Fireblocks), and Jennifer Barker (BNY). The listing provides clear timing and titles, anchoring the conversation in payments infrastructure.
The central bank framed the event as a review of emerging technologies in payments. Prior notices highlighted stablecoins, AI in payments, and tokenization, indicating where supervisory and operational questions will concentrate. That scope sets expectations for risk controls, data standards, and cross-system messaging.
As a result, the conference functions as a venue to align public-sector priorities with private-sector tooling. Panels like today’s help surface requirements around resiliency, auditability, and integration paths into existing rails used by banks and corporates.
Ratings on-chain: S&P stablecoin assessments via Chainlink
S&P Global Ratings moved its Stablecoin Stability Assessments (SSAs) on-chain last week through a collaboration with Chainlink. The product scores leading stablecoins on a 1-to-5 scale based on asset quality, governance, liquidity, redeemability, and track record. Publishing these assessments to blockchains makes the signals machine-readable for protocols and enterprise systems.
Press material dates the announcement to Oct 14 and clarifies that SSAs are not credit ratings. However, the framework gives risk views to on-chain applications that need policy-grade inputs for collateral lists, settlement logic, or circuit breakers. Public pages describe the methodology and intended transparency around depegging risks.
Trade coverage echoed the use case: DeFi platforms can reference current SSA scores directly inside smart contracts. This aligns with today’s Fed themes by connecting recognized risk frameworks to programmable finance.
Market data at scale: Deutsche Börse taps Chainlink DataLink
Deutsche Börse Market Data + Services announced a partnership to deliver regulated market data on-chain across 40+ networks using Chainlink’s DataLink. The feed spans 41 real-time data points from venues including Xetra, Eurex, 360T, and Tradegate, covering multiple asset classes. The release dates to Oct 1 and outlines scope and venues.
Deutsche Börse’s site and unit pages describe the strategic aim: reliable publication of high-quality market data to blockchain networks through Chainlink infrastructure. Asset-servicing trade press reported the same figures and venue list, confirming coverage beyond a single announcement.
Chainlink’s write-up introduces DataLink as the delivery path for these datasets. For payments and tokenization, standardized data feeds help align settlement logic with the same sources used in traditional markets. That point connects directly to today’s policy discussions about consistent controls.
Roadmap context: CCIP broadens reach beyond EVM
Earlier this year, Chainlink shipped CCIP v1.6 with initial non-EVM support on Solana. The upgrade lowered execution costs and sped up integrations, expanding the set of chains that can move messages and assets under one security model. This change widened the interoperability footprint discussed at forums like today’s.
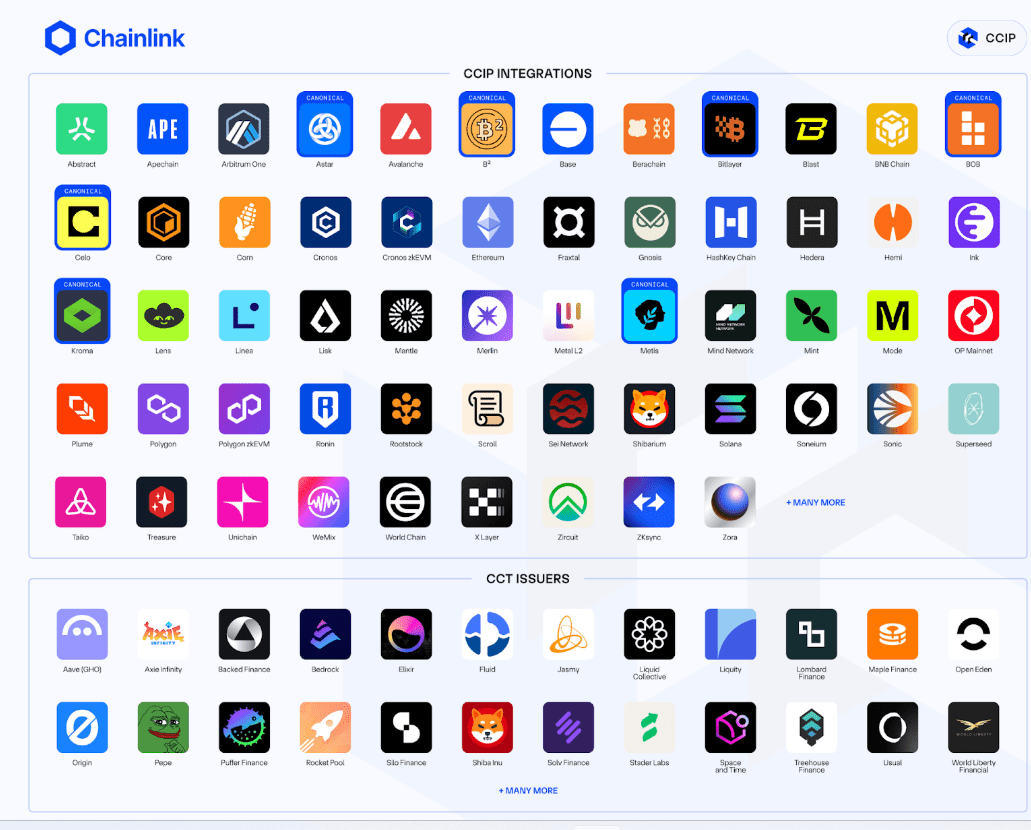
Industry write-ups noted that Solana’s integration added cross-chain token (CCT) support and opened access to additional assets. That development matters for institutions evaluating multi-chain tokenization, where consistent controls across different virtual machines remain a core requirement.
Chainlink’s latest quarterly review summarizes adoption of cross-chain tokens and enterprise data pipelines. The report places recent integrations in a broader push toward standardized connectivity for public and private chains.
Chainlink Attempts Bullish Shift Above the 200 EMA
Chainlink’s 1-hour chart shows a potential momentum shift after price reclaimed the 200-EMA. The chart highlights a clear change in market structure, as LINK moved back above the long-term trend line for the first time since the previous breakdown. This level now acts as a decision zone for buyers, who are attempting to turn former resistance into support.
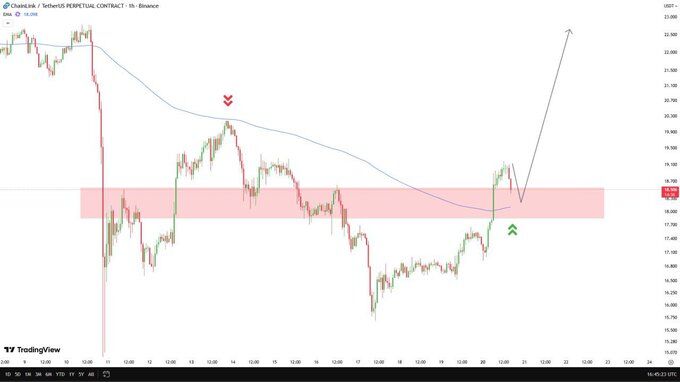
The marked red zone on the chart represents a key supply area where sellers rejected price multiple times in the past. However, LINK has now pushed through that same region and is attempting to retest it from above. If buyers defend this zone during the pullback, the structure supports the idea of trend continuation. This aligns with the strength visible in the latest impulse move, which shows expanding momentum instead of a weak bounce.
The bullish argument depends on confirmation at the EMA retest. A successful higher-low formation above the shaded area would signal control shifting to buyers, allowing price to build a new upward leg. In that scenario, upside targets sit toward previous swing highs. Conversely, if price falls back under the 200-EMA, it would weaken the momentum narrative and re-open the range to the downside. For now, the technical picture favors the bulls, with the market watching the retest zone for confirmation.
Chainlink cost basis clusters point to $16 as the key on-chain battleground
Glassnode’s cost-basis heatmap shows a dense supply node around $16, with about 54.47 million LINK carrying an average cost near that level (data point dated Oct 19, 2025). Cost-basis clusters map where current holders acquired coins. When a large share bought near the same price, that zone often acts as support on declines because many holders prefer not to realize losses.
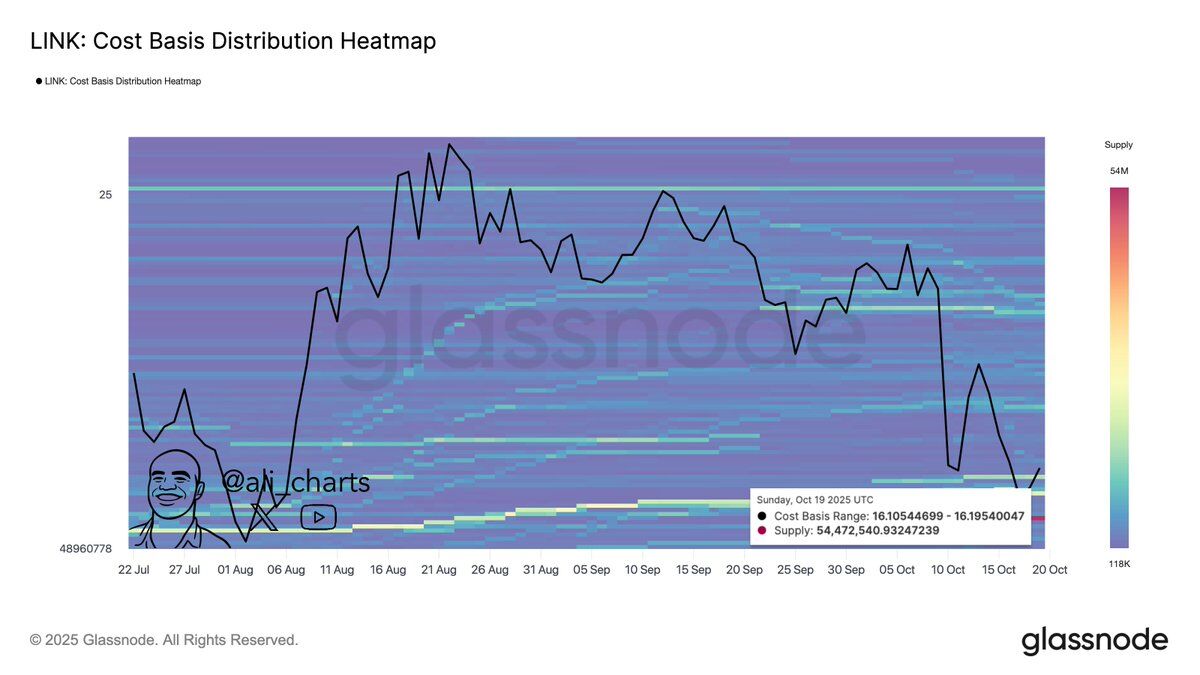
In practice, a heavy node at $16 implies strong demand defense if price retests that area. As price approaches the cluster, previously sidelined buyers with small unrealized gains may add, while underwater holders are less likely to sell. Therefore, transaction flow can slow drawdowns and encourage base-building above the band.
However, on-chain support is conditional. If price closes and holds below $16, the same cohort can flip into overhead resistance as break-even sellers emerge on bounces. The heatmap’s breadth matters too: a thick band signals wider participation and stronger defense; a thin band weakens the signal.
Finally, use this level alongside market-structure tools. A rising 200-EMA, higher-low sequence, or expanding spot demand would reinforce the $16 floor. Conversely, weakening momentum, negative funding, or falling exchange outflows would undercut it. The takeaway from this chart alone: $16 is the dominant on-chain pivot where behavior is likely to concentrate.
Chainlink sits on pivotal intraday support as traders watch confirmation
Chainlink’s 1-hour LINK/USD chart shows price pulling back into a key decision zone between $17.80 and $17.60, which now acts as pivotal support. This area previously served as resistance, and price is retesting it from above after the latest impulse move. When former resistance becomes support, the market often pauses to decide whether momentum can continue or fade.
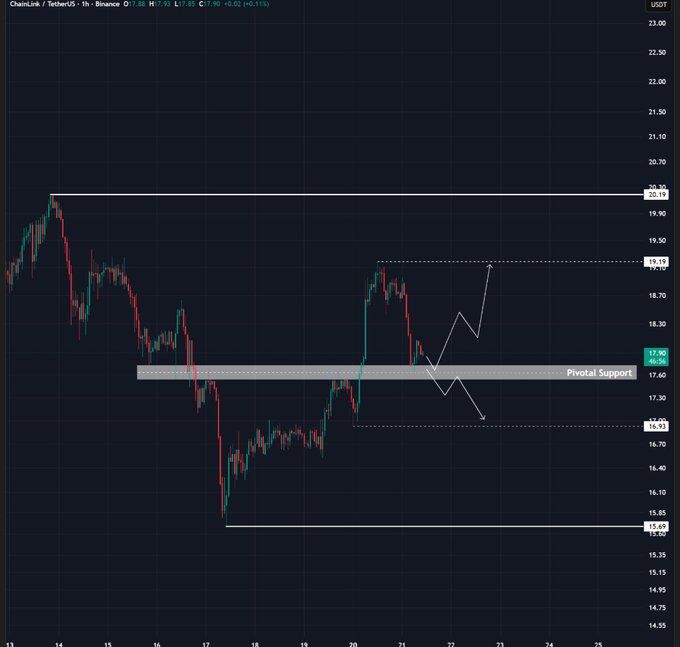
If buyers defend this band and print a higher low, the structure favors another leg upward. In that scenario, the chart points to $19.10–$19.20 as the next upside reaction zone. A successful bounce would signal that bulls still control short-term momentum, as demand would be stepping in at a logical technical level instead of waiting higher. That type of reaction often leads to a continuation pattern rather than a deeper retracement.
However, if price breaks below $17.60 and accepts under the zone, the narrative shifts. That failure would weaken the current structure and open room toward the next demand cluster around $16.95. In that case, sellers would reclaim short-term control, and the chart would likely reset into a broader consolidation. For now, the market sits at an inflection point, and the reaction at this support band will determine the next directional wave.
Chainlink RSI shows tentative momentum repair below the 50 neutral line
The 14-period RSI sits near 43 and has crossed above its signal average (~40). This cross signals short-term improvement after early-October weakness. However, momentum remains below 50, so the broader bias is still neutral-to-soft rather than bullish.

Recent RSI swings outline stabilization. After dipping toward the 30 zone in early October, the oscillator formed a higher low and curled upward. This pattern often precedes base-building, especially when the RSI holds above the 40–42 band on pullbacks. Therefore, the next few sessions will test whether buyers can keep momentum from fading back to oversold risk.
The confirmation threshold is clear. If RSI reclaims and sustains above 50, upside momentum typically broadens, allowing price to challenge prior supply zones with stronger follow-through. Conversely, if RSI rolls back under 40, pressure usually returns and a retest of the 30–33 area becomes likely. In short, the oscillator shows early repair, but the 50 line remains the pivot that decides trend extension versus another fade.