
Sui Market cap climbed to $13.87B today on CoinMarketCap. It closed the session near the high after a steady push that began from the morning lull.
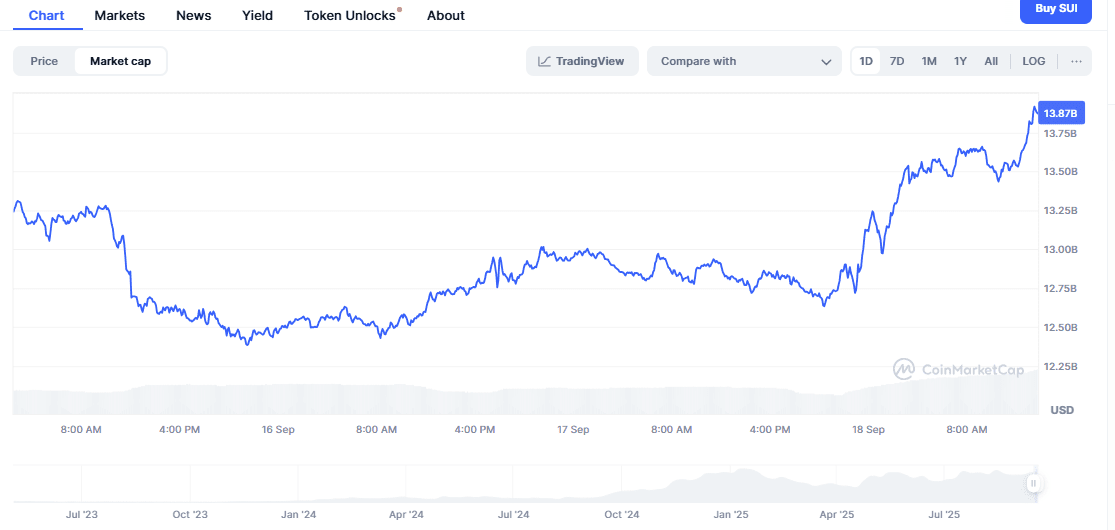
Earlier, Sui Market cap dipped toward the mid $12B area. Then buyers reversed the slide and reclaimed the prior range around $13.1B. The move continued in a staircase pattern of higher highs and higher lows.

Through the afternoon, Sui Market cap held gains above $13.3B and based there. Afterward, momentum carried the chart into a fresh peak at $13.87B. Pullbacks remained shallow, and support formed near $12.9B to $13.0B.
Overall, the chart shows a recovery from early weakness, a breakout above the intraday range, and a close near the top. Sui Market cap ends the day firmly higher with strength concentrated in the final leg.
SUI prints bullish flag on September 18, 2025; breakout would imply a 58% move toward $6.12
On September 18, 2025 the SUI/USD chart on Binance shows price near $3.87, up 2.61% on the day. The daily view depicts a downward-sloping parallel channel that formed after July’s sharp advance, while price now presses the channel’s upper rail.
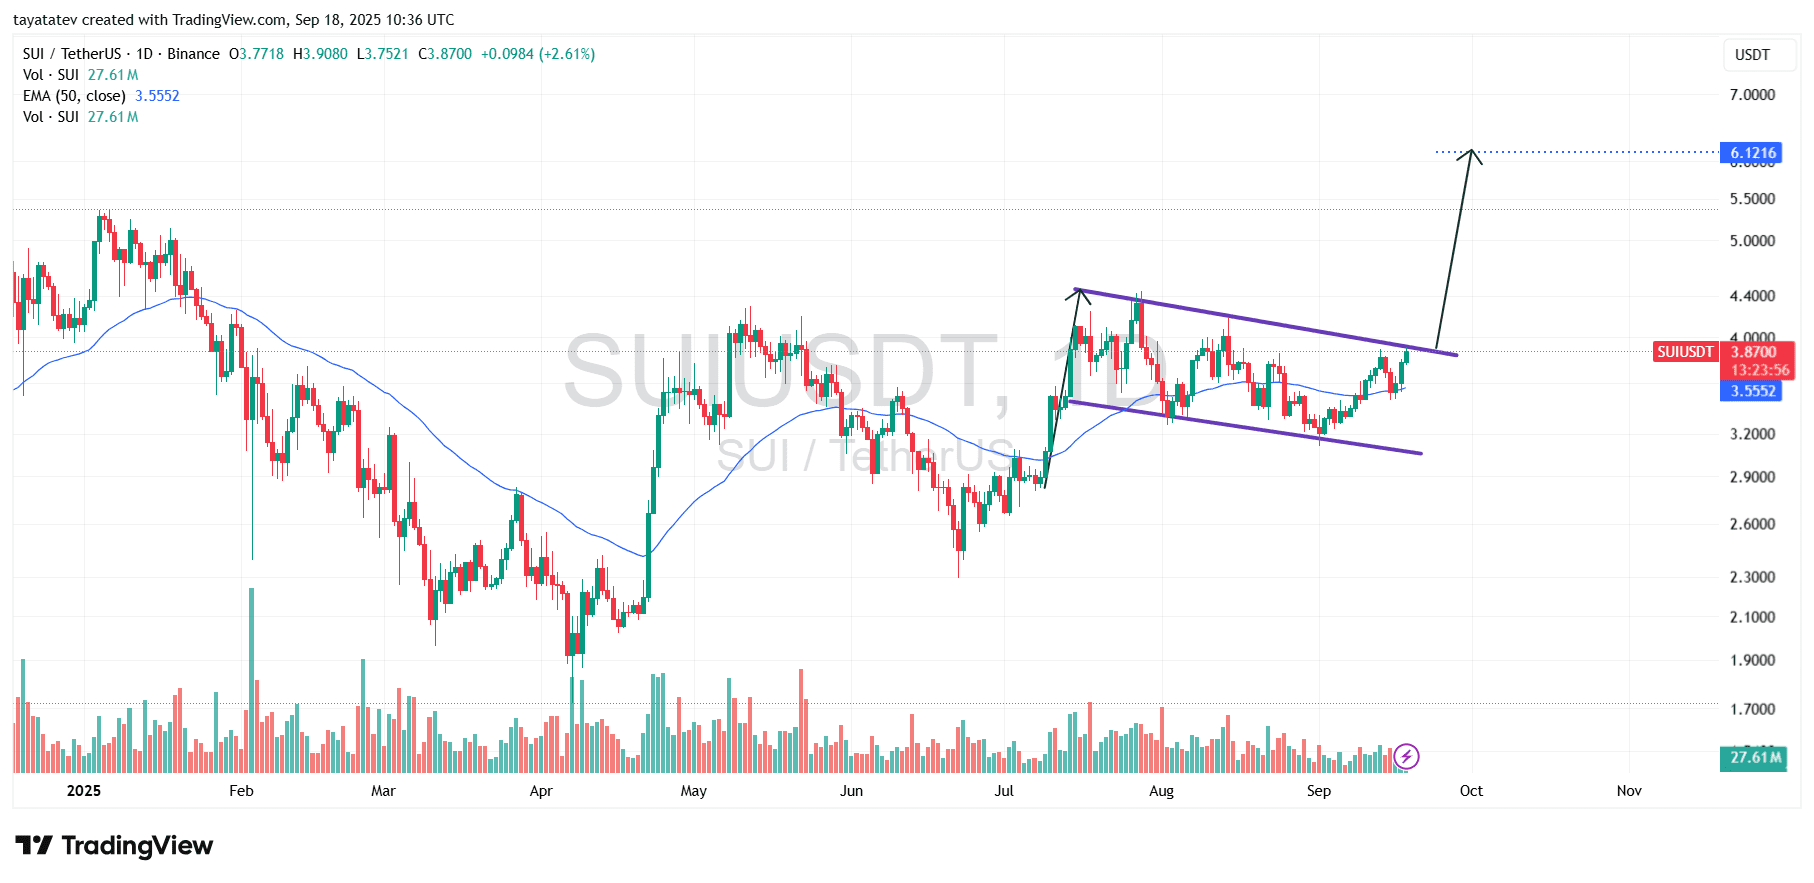
The chart creates a bullish flag pattern. A bullish flag pattern shows a strong climb known as the flagpole, followed by a tight, downward-tilting consolidation channel that often precedes continuation. Price rides above the 50-day Exponential Moving Average at $3.56 and holds a sequence of higher lows inside the channel, which keeps the structure intact.
Confirmation requires a decisive break and daily close above the flag’s upper boundary near $4.00 with rising volume. If that breakout confirms, the measured continuation from the current level implies a 58% advance to about $6.12. Until then, the setup remains a consolidation, with the Exponential Moving Average near $3.56 acting as nearby dynamic support and the lower rail around the low $3.30s marking the risk area visible on the chart.
SUI RSI turns bullish above midline on September 18, 2025
On September 18, 2025 at 10:45 Coordinated Universal Time, the SUI Relative Strength Index (14) reads 60.71 with its signal line near 53.59. The oscillator holds above the 50 midline and rises with a clear upslope, which shows strengthening momentum as the day progresses.
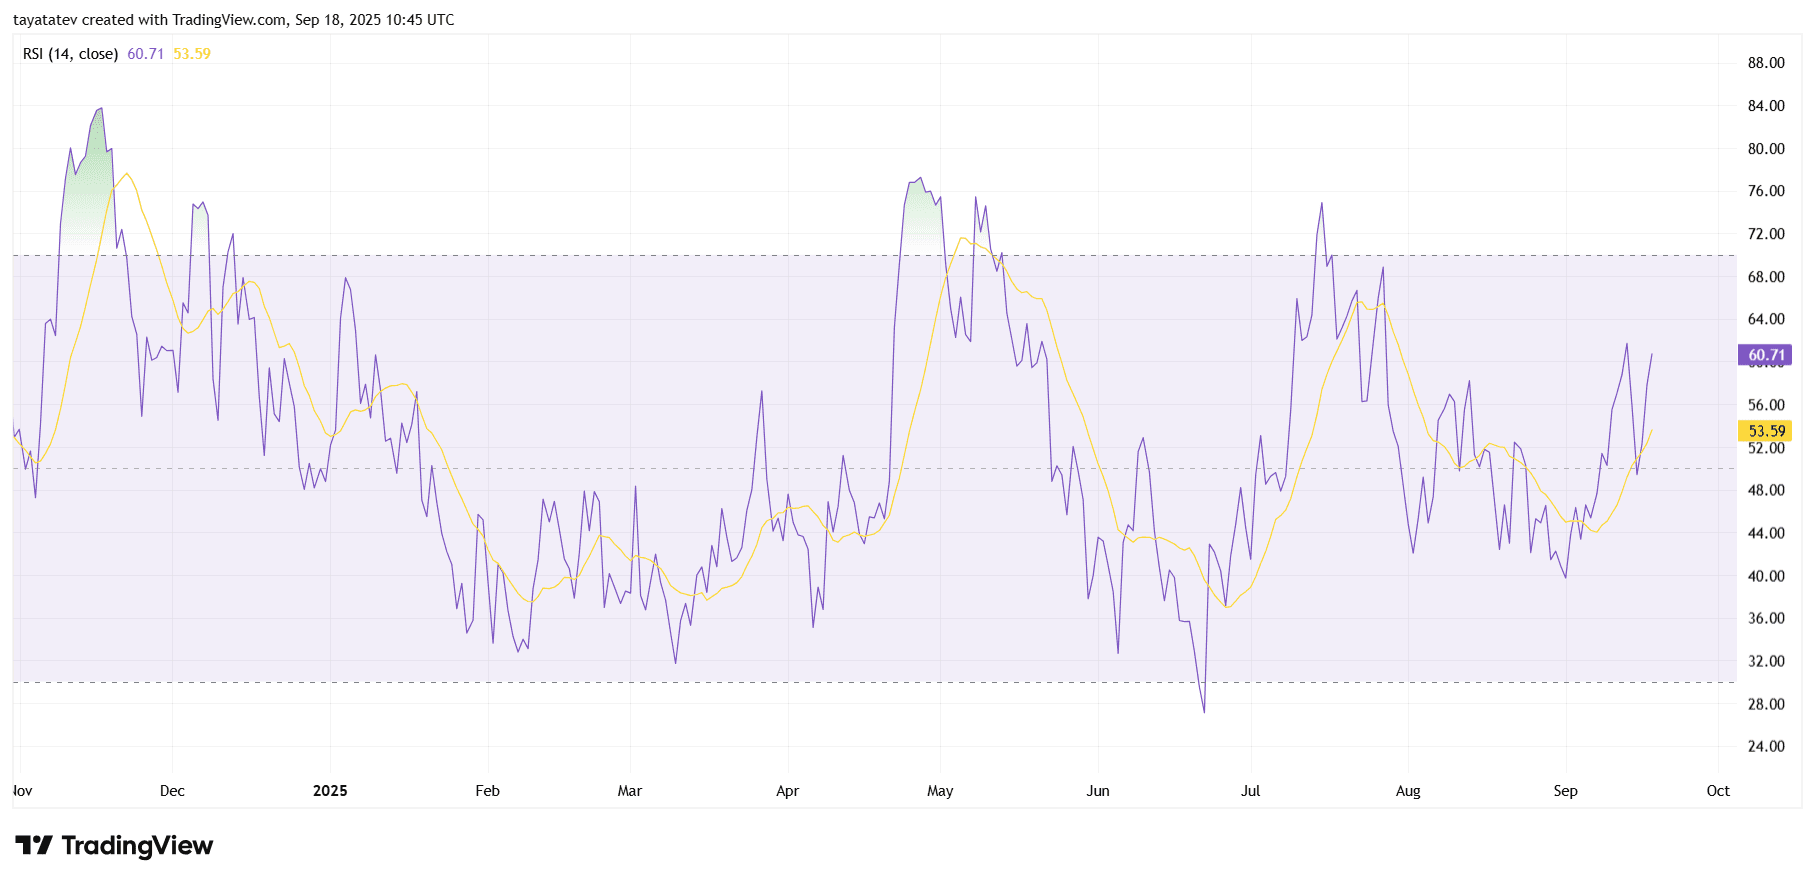
The Relative Strength Index measures the speed and magnitude of price moves on a 0–100 scale, where readings above 50 favor buyers while 70 and 30 mark typical overbought and oversold zones. Today’s push through the midline follows a steady climb from early-September lows and places the indicator back in positive territory.
Momentum improved as the purple RSI line crossed and stayed above its signal line, and the signal line itself turned higher. The chart also shows prior momentum waves reaching into the high-60s and low-70s during May and again in late July, periods that coincided with stronger upside phases. By contrast, dips under 50 earlier in the summer aligned with weaker stretches.
Taken together, the current 60–61 reading supports the constructive structure visible on the price chart. If the oscillator drives into the 70 zone, it would indicate strong follow-through. However, if it slips back below 50, it would show fading momentum and a return to neutral conditions.
Sui joins Google AP2 launch for AI agent payments
Google introduced the Agent Payments Protocol today and listed Mysten Labs, the original contributor to Sui, among launch collaborators. A Sui ecosystem project, Walrus, also said Sui is a launch partner. Industry coverage notes more than sixty organizations joined the initial cohort.

The protocol targets verifiable, auditable payments between AI agents. It uses open standards alongside existing agent frameworks and supports both traditional rails and crypto, including stablecoins, through participating providers. Google and payments firms describe AP2 as an open specification that aims to standardize consent and accountability for agent-initiated transactions.