
Sui rolled out Flipside’s natural-language analytics, appeared on the U.S. SEC’s Crypto Task Force meeting log, and expanded developer tooling with a GraphQL RPC and Indexer public beta. Network operations remained normal, and the foundation confirmed a Builder House event in Seoul on September 25, 2025.
Flipside AI brings plain-English analytics to Sui
Sui Foundation said Flipside now supports Sui, allowing users to ask simple questions and receive structured on-chain results without SQL. The foundation posted the update on September 12, 2025.

The announcement frames the integration as a way to “unlock” Sui data for broader use across the ecosystem. It highlights natural-language queries as the starting point for exploring activity trends.
Sui’s official account also promoted the launch, reiterating that Flipside support is live. The post notes broader access to insights and points users to the new workflow.
SEC lists Sept. 9 meeting with Mysten Labs
The SEC’s Crypto Task Force meeting schedule records a September 9, 2025 meeting with Mysten Labs and Sidley Austin. The entry sits among other September meetings with industry participants.
The SEC page functions as a public log for Task Force engagements. It lists dates and counterparties; it does not publish minutes or conclusions.
Separately, the Task Force announced a public roundtable on financial surveillance and privacy, with the notice last reviewed on September 9. This item underscores the agency’s ongoing outreach.
GraphQL RPC and Indexer enter public beta
Sui introduced a public beta for its GraphQL RPC alongside a general-purpose Indexer on September 10, 2025. The foundation said the stack aims to make querying and building with Sui data simpler and more consistent.
The GraphQL RPC provides a high-level query interface, while the Indexer organizes chain data for faster, filterable access. The post outlines developer entry points and migration details.
The foundation positioned the beta as part of a broader push to standardize data access across mainnet and testnet. It directs developers to documentation and endpoints for immediate testing.
Sui’s official status page reports no incidents today, September 13, 2025. The page shows the same result across recent days.
The incident history lists “No incidents reported” for September 12 and September 11, indicating stable operations this week.
The history view extends across the month and continues to show normal service. The page updates as issues arise.
Sui schedules Seoul Builder House for September 25
Sui Foundation set “Builder House: APAC” for Thursday, September 25, 2025, in Seoul. The post provides venue details and timing for the one-day program.
The community events hub lists the same date and describes the format as a conference with product and partner updates, demos, and networking. Registration links are available on the page.
The “Sui in Seoul” landing page also promotes the gathering during Korea Blockchain Week. It serves as an event portal for attendees.
SUI formed a falling wedge from early August to September 10, 2025. A falling wedge is a bullish setup where price makes lower highs and lower lows inside two converging downward lines; once price closes above the upper line, momentum often turns higher.
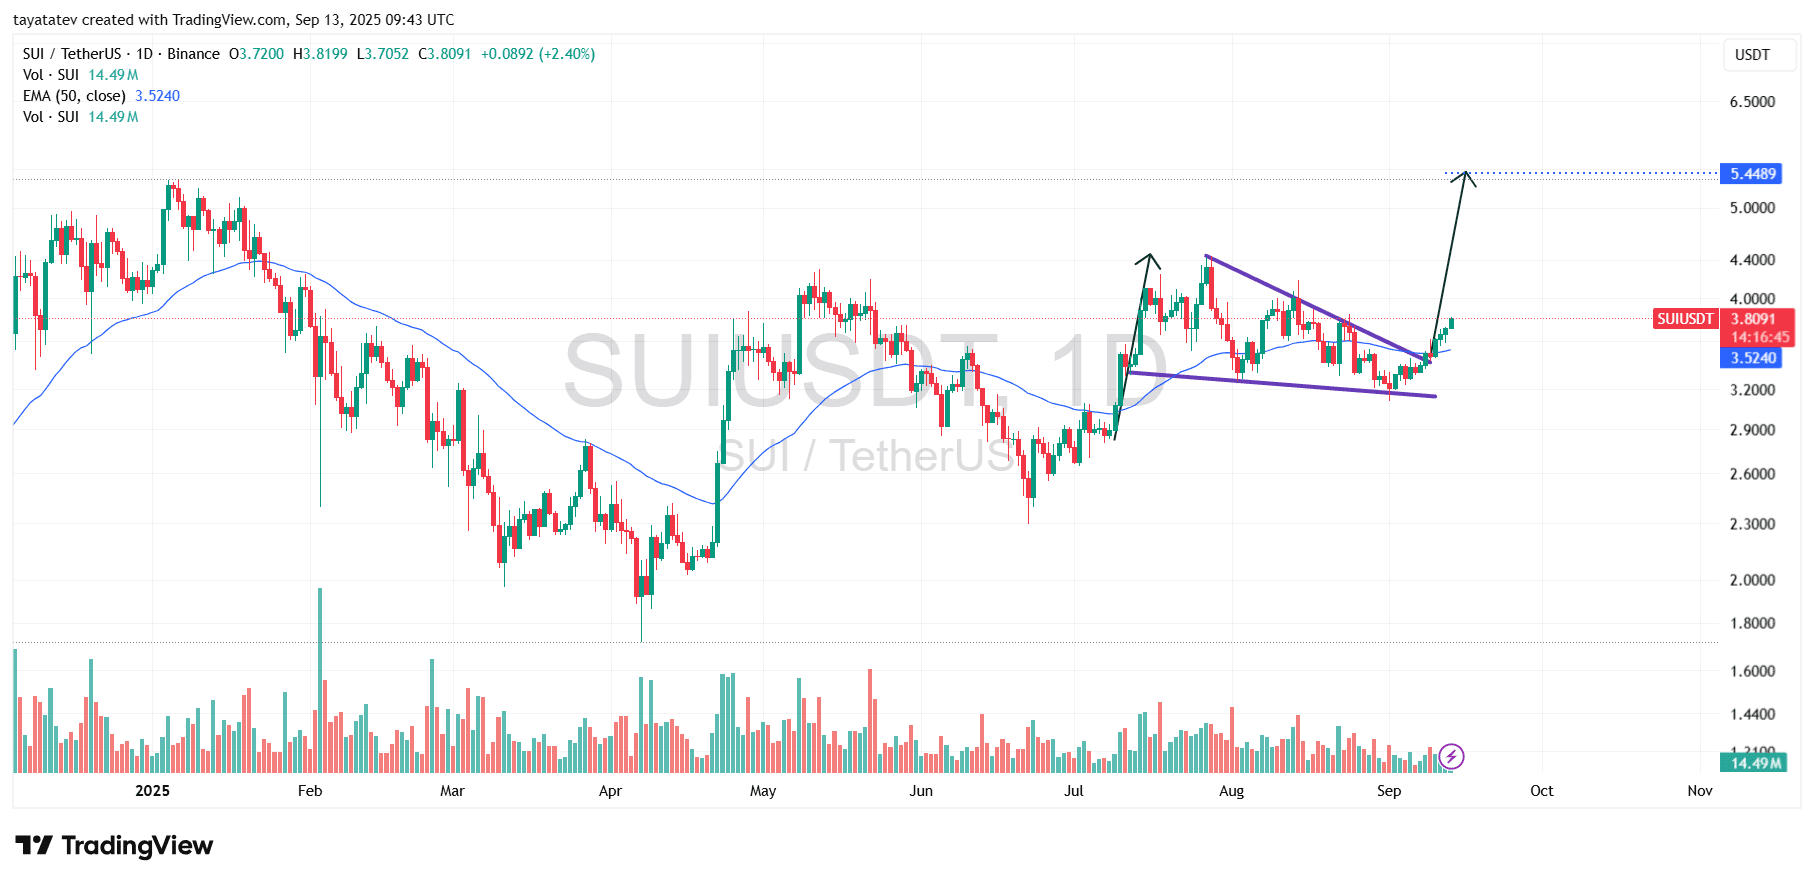
On September 12, SUI/USD closed above the wedge’s upper boundary and confirmed the breakout. Price then advanced roughly 10% beyond the former ceiling and now trades near $3.81 on the daily chart captured September 13, 2025, 09:43 UTC. The move also reclaimed the 50-day EMA around $3.52, which keeps near-term control with buyers.
The measured objective derives from the wedge’s initial height added to the breakout level. Using that method, the setup projects toward the low-$5 area. From the current price, that path implies about 42% upside to roughly $5.41, aligning with the chart’s annotated ~$5.45 marker.
Momentum signals support the shift. Price held above the broken trendline on intraday dips, turning it into support. Moreover, successive higher lows and a higher high after the breach confirm a constructive daily structure.
However, traders will watch validation levels. As long as SUI holds the former wedge top and the 50-day EMA on daily closes, the $5.41 objective remains active. A decisive close back below those references would weaken the breakout and delay the advance.
MACD turns positive as Sui momentum builds
SUI’s daily MACD flipped bullish on the Sept. 13, 2025 snapshot at 09:57 UTC. The MACD line trades above the signal line and above the zero line. The histogram prints green bars that expand, which signals strengthening upside momentum.
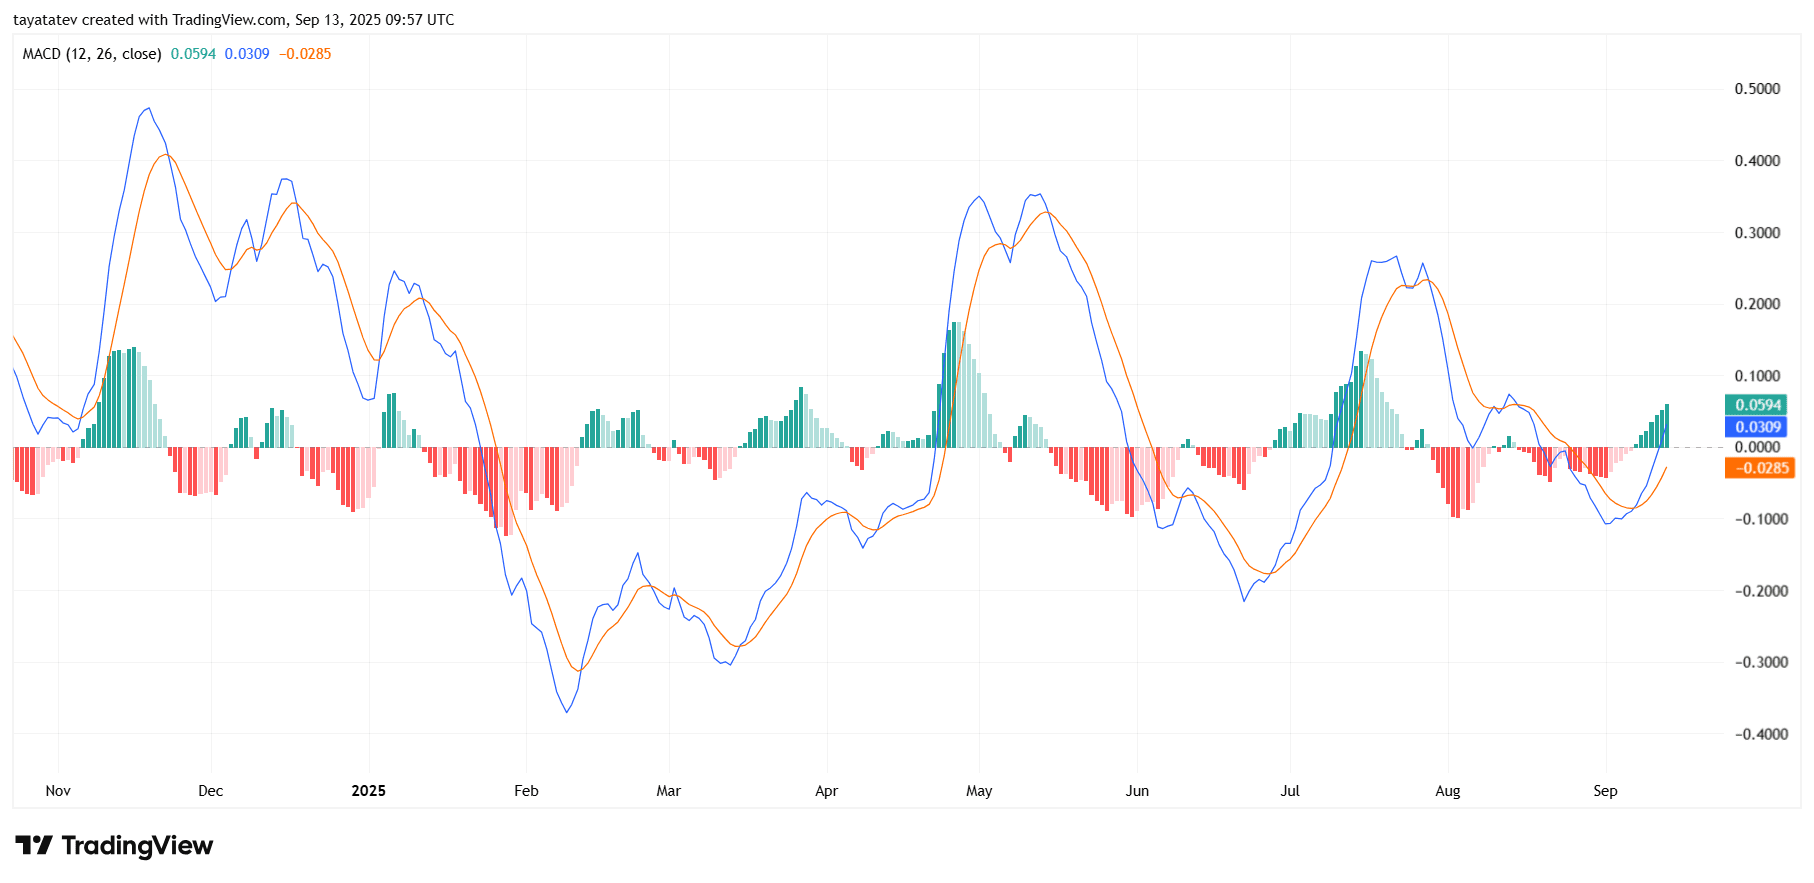
Today, the MACD reads about 0.059 while the signal line sits near 0.031. Therefore, the histogram measures roughly +0.029. This positioning confirms a clean bullish crossover with follow-through. Moreover, the move above zero marks a momentum regime shift on the daily timeframe.
The crossover began in early September after a shallow basing phase. Since then, each session extended the green histogram, showing rising positive momentum. Meanwhile, pullbacks have not erased the crossover, which keeps the bullish read intact.
Context from earlier cycles adds perspective. In May and July, similar cross-above-zero events preceded multi-week upswings on this chart. The current amplitude remains smaller than those peaks, so momentum has room to expand before reaching prior extremes. However, the signal stays the same: buyers control near-term impulse.
This MACD profile aligns with the recent falling-wedge breakout on price. Continued prints above the zero line would corroborate the trend shift visible on the candles. Conversely, a drop back below the signal or a fade toward zero would cool momentum and slow the advance.
RSI shifts to a bullish range as momentum expands
SUI’s daily RSI reads about 61.6 on the September 13 snapshot at 10:01 UTC. The line pushed through the 50 midpoint in early September and kept rising, which signals a regime shift toward bullish momentum. The RSI moving average sits near 49.2, so the oscillator holds comfortably above its trend gauge.
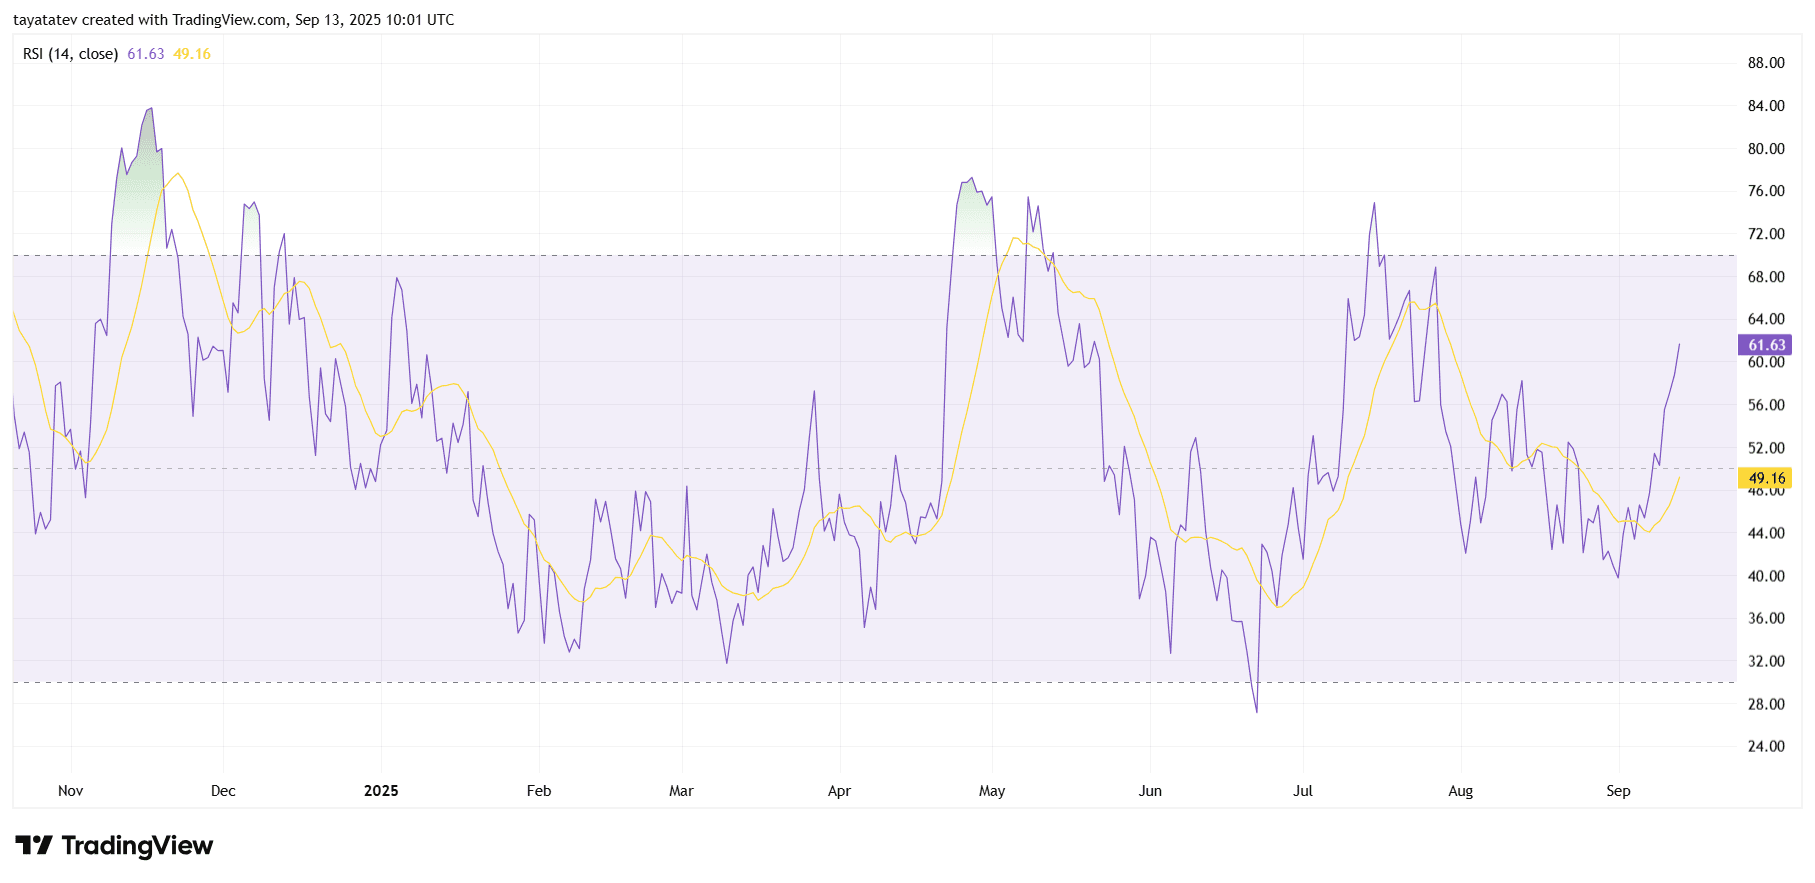
The structure shows higher lows in the oscillator through September, then a decisive push into the 60s as price broke out. This pattern reflects improving demand because the RSI spends more time above 50 during advances. As long as the oscillator holds that zone, momentum typically favors continuation.
Context from earlier waves adds clarity. In late July the RSI briefly reached the low 70s before fading. Today it remains below the overbought band near 70, which leaves room for additional upside pressure before the indicator reaches prior extremes. The slope stays positive and no clear bearish divergence appears on this daily view.
If the RSI later pulls back, the 50 area becomes the pivotal line to watch because strong uptrends often defend that midpoint on dips. A sustained fall back under 50 would cool momentum and signal a return to a neutral regime. For now the RSI range shift aligns with the recent falling wedge breakout on price and confirms building strength.