

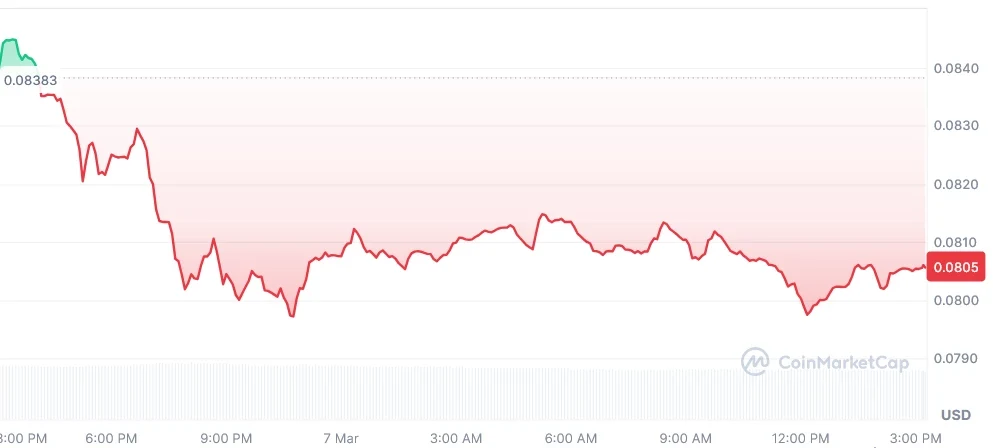
The Sandbox (SAND) fell 4.55% in today’s March 7, 2026, trading session, highlighting short-term weakness for the metaverse token.
The 24-hour trading volume declined to $27.15 million, while market capitalization dropped to $236.7 million, according to CoinMarketCap. Traders are closely watching the $0.0776 support zone for potential rebounds.
At the time of writing, the token is trading at $0.08057. The token remains within a range-bound pattern, with immediate resistance around $0.0934.
Analysts note that sustained buying above $0.0852 could trigger a rally toward this resistance, but a break below $0.0776 may accelerate bearish momentum.
Also Read: The Sandbox (SAND) Eyes $2.65 as Falling Wedge Signals Potential Breakout
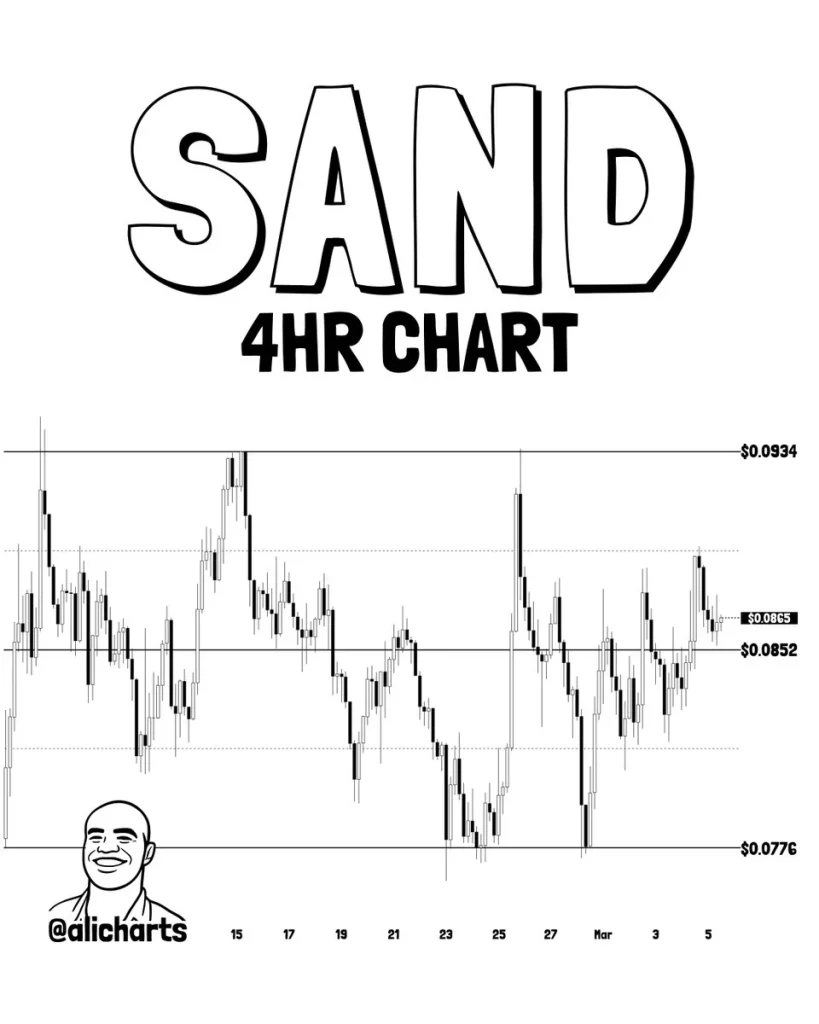
Price Consolidation Between $0.0776 and $0.0934
On the 4-hour chart, the price of SAND has stabilized at $0.0865 following a rebound from $0.0776. The price has formed a demand zone as buyers have entered the market.
The price fluctuations between $0.0852 and $0.0934 are a result of the tug of war between buyers and sellers, implying a range-bound market.
As per the crypto analyst, if the price experiences a momentum boost above the level of $0.0934, this might propel the price to gain more bullish momentum. Conversely, if the price drops below the level of $0.0852, SAND might drop towards the level of $0.0776.
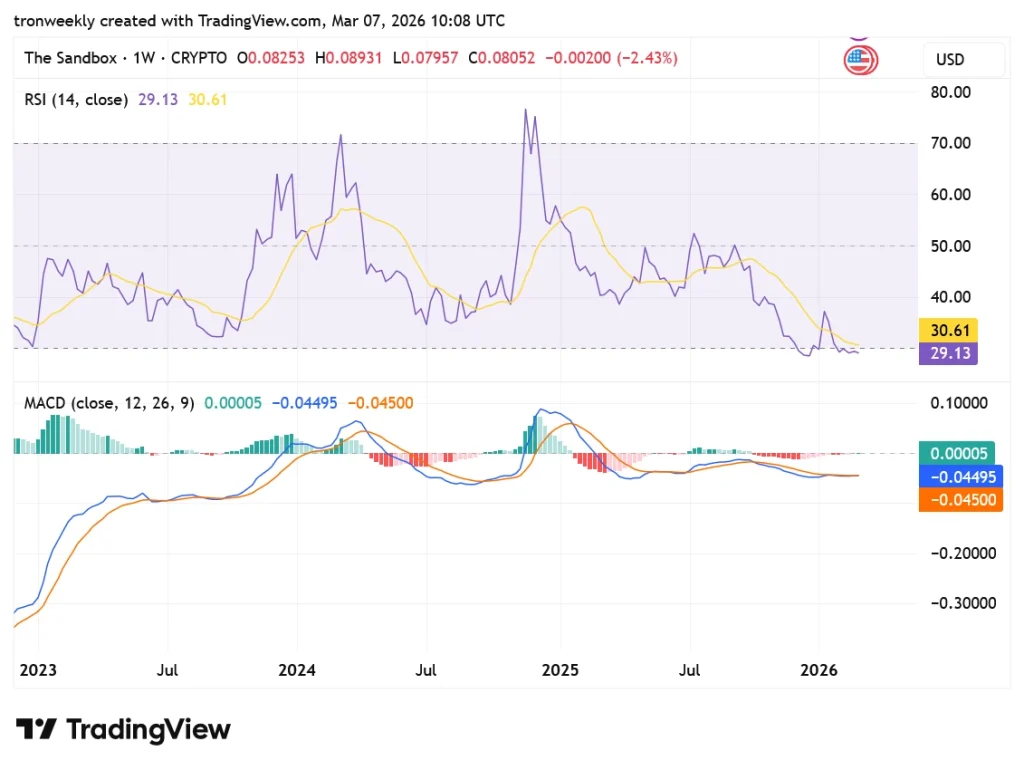
Indicators Show RSI at 29.14, MACD Weak Momentum
From a technical perspective, RSI (14) is at 29.14, while the signal is at 30.61. This places the weekly chart in the oversold zone. This indicates selling pressure over the past few weeks. The level of 35 to 40 will be a buy signal for rekindled momentum.
The MACD (12, 26, 9) is showing soft momentum, with the MACD line at -0.04494 nudging just below the signal line at -0.04500. The histogram is also at 0.00005, which indicates diminishing volatility.
It appears to be a weak bullish case, and only a strong bullish crossover would confirm the start of a new trend in terms of momentum.
Why This Matters
SAND’s decline and oversold status illustrate the importance of key support and resistance points for investors seeking to navigate the metaverse market.
Traders can keep an eye on the $0.0776 price as a support point and the $0.0934 price as a resistance point for the token.
Also Read: The Sandbox (SAND) Poised for Explosive Move Toward $2.60