
Tron gas fees fell sharply after Tron Proposal 789 took effect on August 29. Consequently, Tron daily revenue for Super Representatives dropped to 5 million dollars on September 7. That was a 64 percent decline from 13.9 million dollars the day before the change, according to a CryptoQuant report. The level marked a new low in over a year. Meanwhile, Token Terminal revenue data shows Tron still outpaces other layer-1 networks.
Tron Gas Fee Cut and Revenue Impact — Tron Daily Revenue, TRX Gas Fees, CryptoQuant Report
Tron implemented Tron Proposal 789 to lower TRX gas fees. The network reduced the energy unit price from 210 sun to 100 sun. As a result, average Tron gas fees declined by about 60 percent.

The revenue effect appeared within 10 days. Tron daily revenue for Super Representatives reached 5 million dollars on September 7. Previously, the figure stood at 13.9 million dollars on August 28. The CryptoQuant report linked the drop to the new fee parameters.
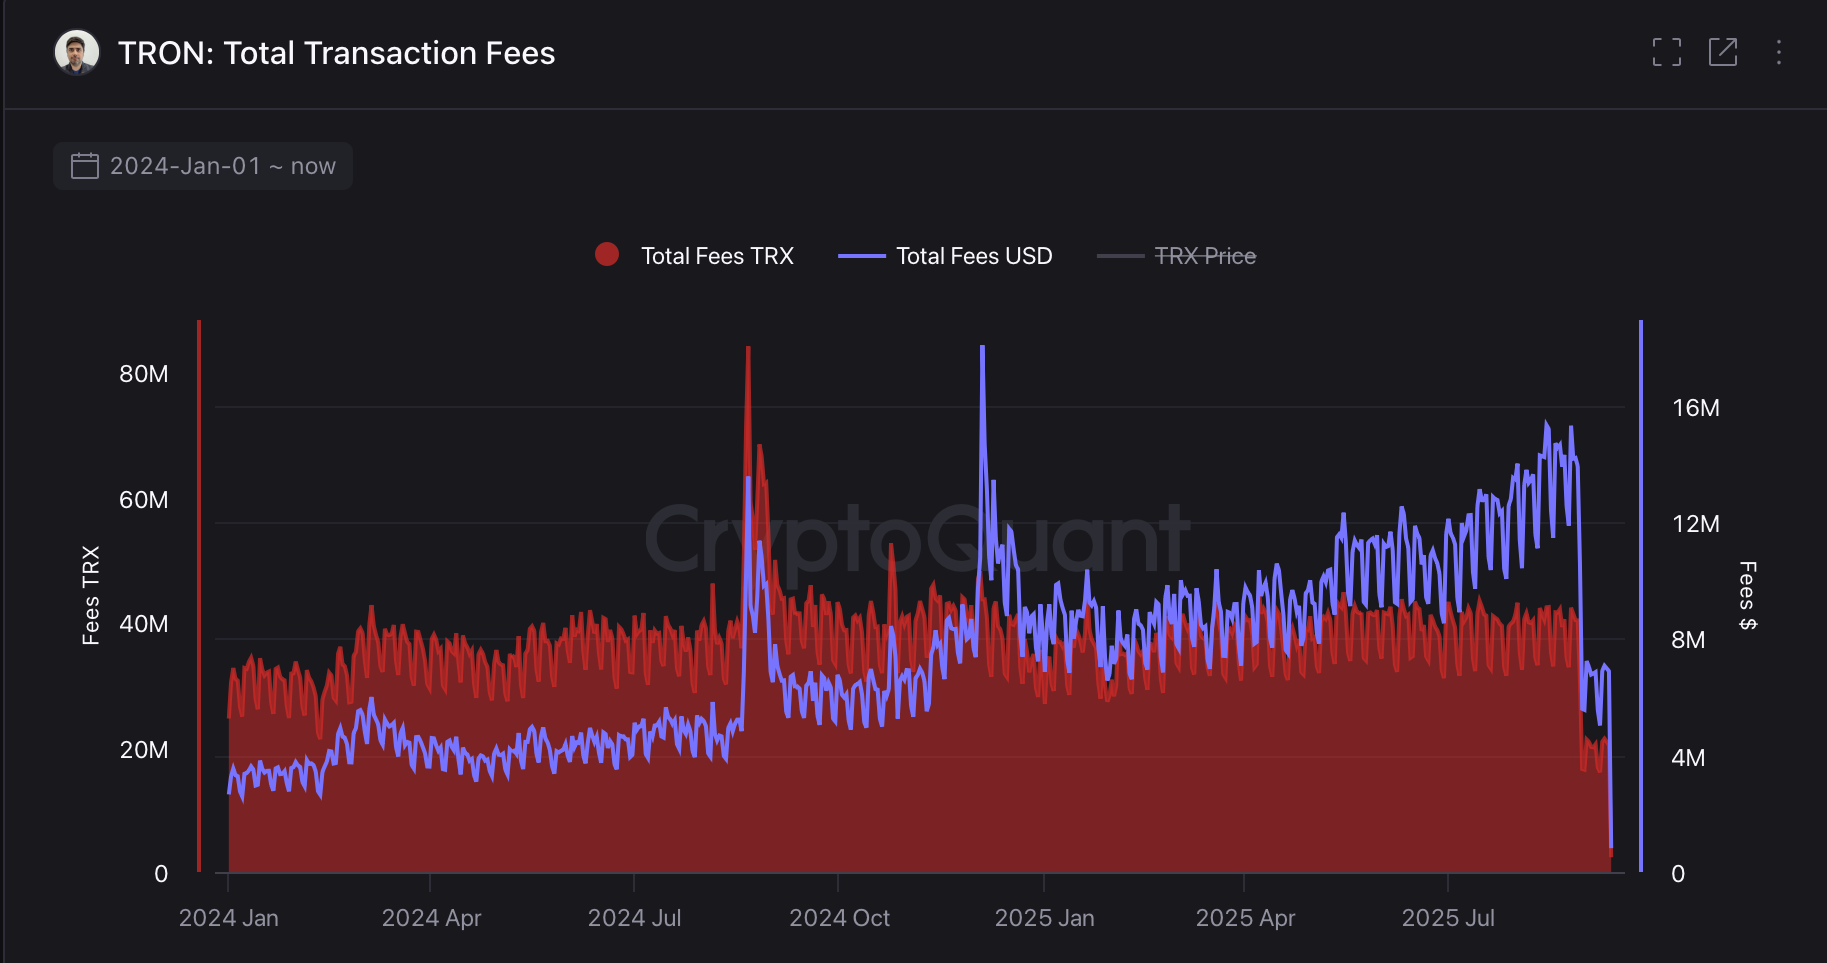
Block producers absorbed the change first. Super Representatives process transactions and collect fees. Therefore, lower TRX gas fees reduced fee income immediately. The charted series highlighted the trough reading on September 7. Additionally, it showed the pre-cut level right before Tron Proposal 789 went live.
Tron Proposal 789 and TRX Gas Fees Explained — Sun Units, TRX Conversion, GrothenDI Rationale
Tron Proposal 789 passed a community vote on August 29. The proposal cut the energy unit price to 100 sun. In Tron accounting, users pay TRX gas fees in sun, the smallest unit of TRX.
One TRX equals 1,000,000 sun. This conversion standardizes TRX gas fees across transactions. It also lets the protocol tune costs at the sun level. Consequently, reducing sun pricing lowers each transaction’s fee burden.
Community member GrothenDI authored Tron Proposal 789. The rationale said the change would “ensure the sustainable and healthy development of the Tron ecosystem.” The author also estimated up to 12 million additional potential transfers at 100 sun. The statement positioned the cut as a usage catalyst. However, it did not set a revenue target or timeline.
Tron Layer-1 Revenue Share — Token Terminal Revenue, Ethereum vs Tron, Solana, BNB Chain
Despite the Tron gas fees cut, Token Terminal revenue data shows Tron leads recent layer-1 earnings. Over the past seven days, Tron captured 92.8 percent of layer-1 revenue. The share exceeded Ethereum, Solana, BNB Chain, and Avalanche during that window.
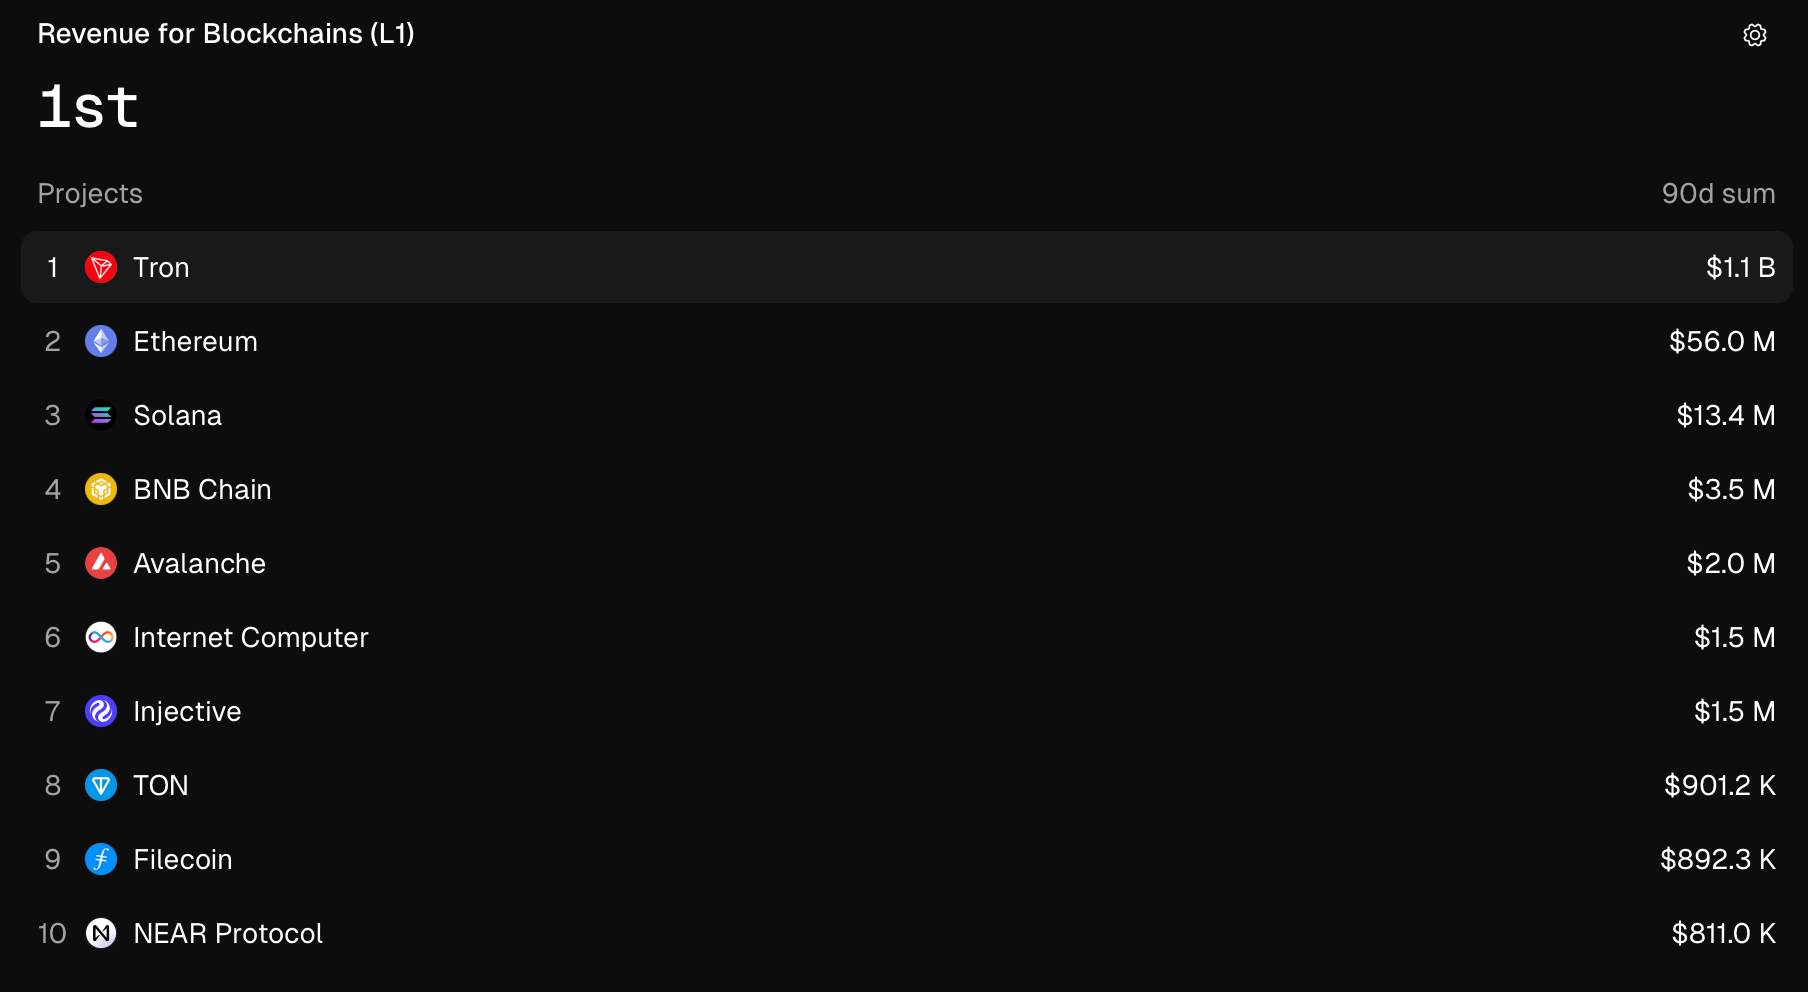
Over 90 days, Token Terminal revenue data attributes about 1.1 billion dollars in fees to Tron. The period covers the weeks before and after Tron Proposal 789. It also reflects sustained TRX gas fees activity tied to stablecoin transfers and everyday payments on the network.
For a longer horizon, Ethereum vs Tron remains instructive. Over five years, Ethereum generated roughly 13 billion dollars in revenue. Tron recorded about 6.3 billion dollars in the same five-year span. The figures place Ethereum ahead historically, while recent snapshots show Tron leading weekly layer-1 revenue.
RSI 14 prints 59.05 with its signal at 47.67, placing momentum above the 50 midpoint and below the 70 ceiling. The line rebounded from an early-September trough in the low 30s and now holds in the upper 50s, which marks a clear shift from neutral to positive on this timeframe. Through late 2024 and again in July–August 2025, the oscillator pushed near or above 70, while most pullbacks in Q1–Q2 2025 stabilized around 40–45 before turning up. The current read sits closer to prior acceleration zones than to stress levels seen near 30–35.
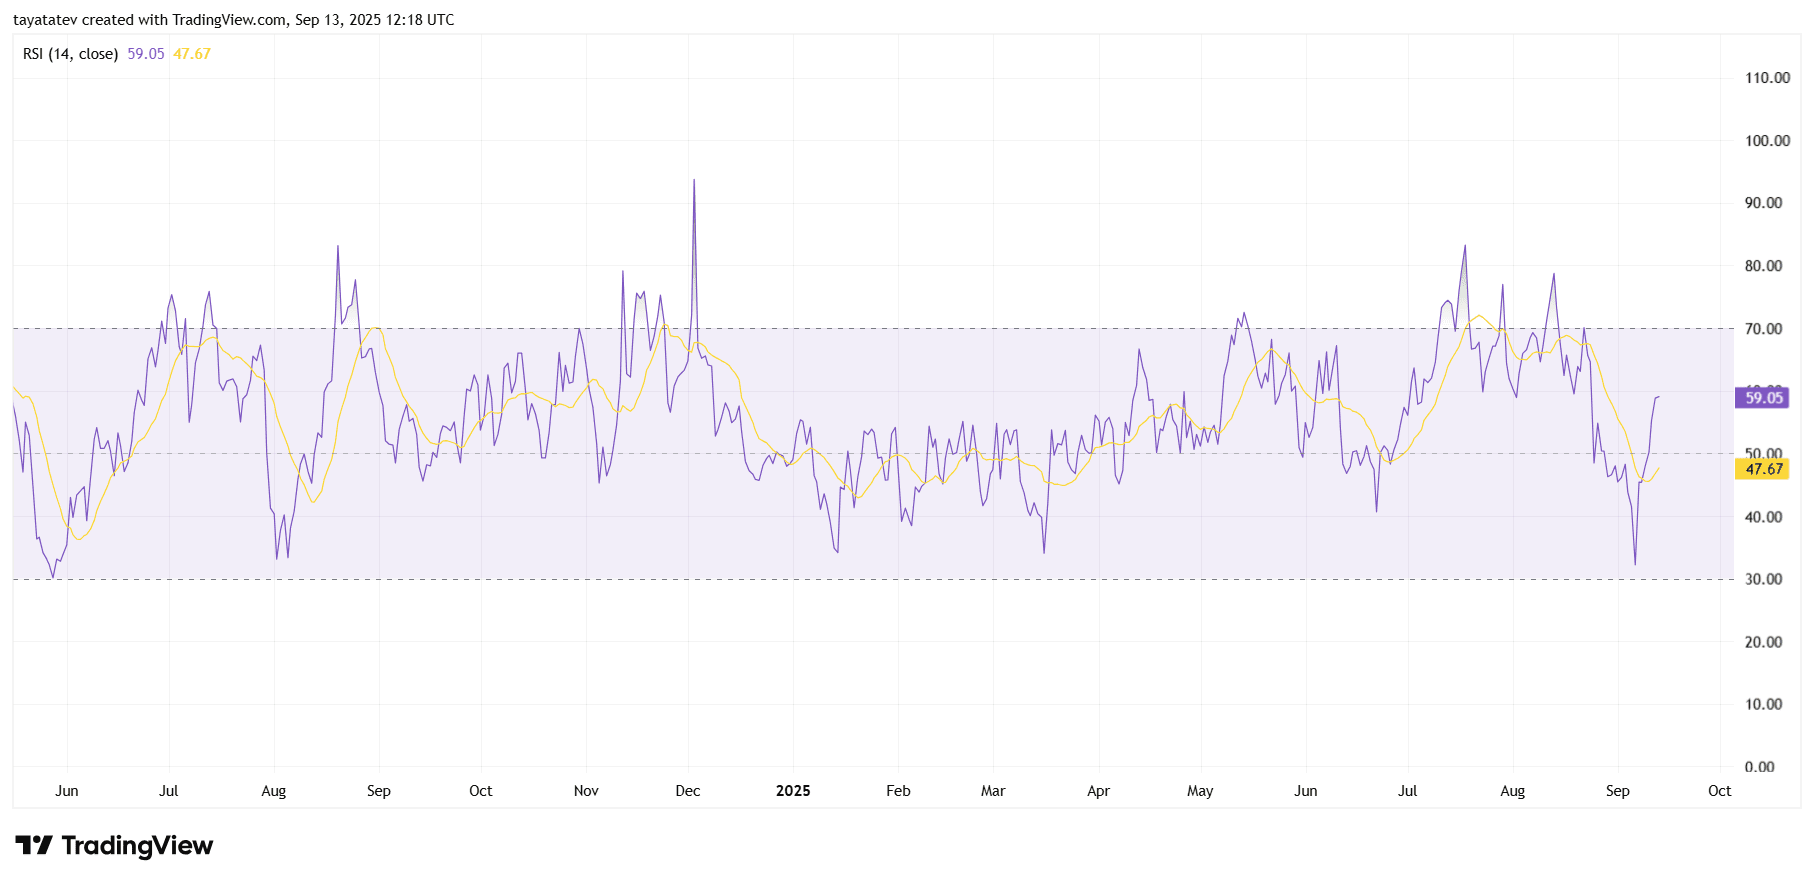
The RSI line has crossed above its signal and continues to track higher. That cross follows a brief period where momentum faded below 50, then recovered quickly. Historically on this chart, sustained holds above 50 aligned with trend continuity, while dips into 40–45 coincided with pauses rather than full reversals. The recent bounce mirrors that behavior: a quick excursion to the low 30s, a fast reclaim of 50, and a push to ~59. However, the oscillator remains under 70, so it has not registered an overbought print on this swing.

Context from the past year shows a range-bound rhythm between 40–45 support and 65–70 resistance, punctuated by brief spikes. The present level sits inside that upper half and follows increasing volatility in July–August 2025. If the RSI were to revisit the 50–52 area, prior episodes suggest that zone often acted as a momentum hinge; conversely, reactions near 65–70 frequently capped rallies on this timeframe. Price is not displayed here, so classic bullish or bearish divergences cannot be confirmed, and this read should be taken as a momentum snapshot of the provided RSI plot only.
MACD momentum snapshot — TRX Daily
MACD (12,26, close) reads 0.00089, the signal line sits near −0.00080, and the histogram prints about 0.00169. Consequently, the histogram has turned positive and expanded in recent sessions. The MACD line has crossed above the signal line during the second week of September. It now tracks very close to the zero line.
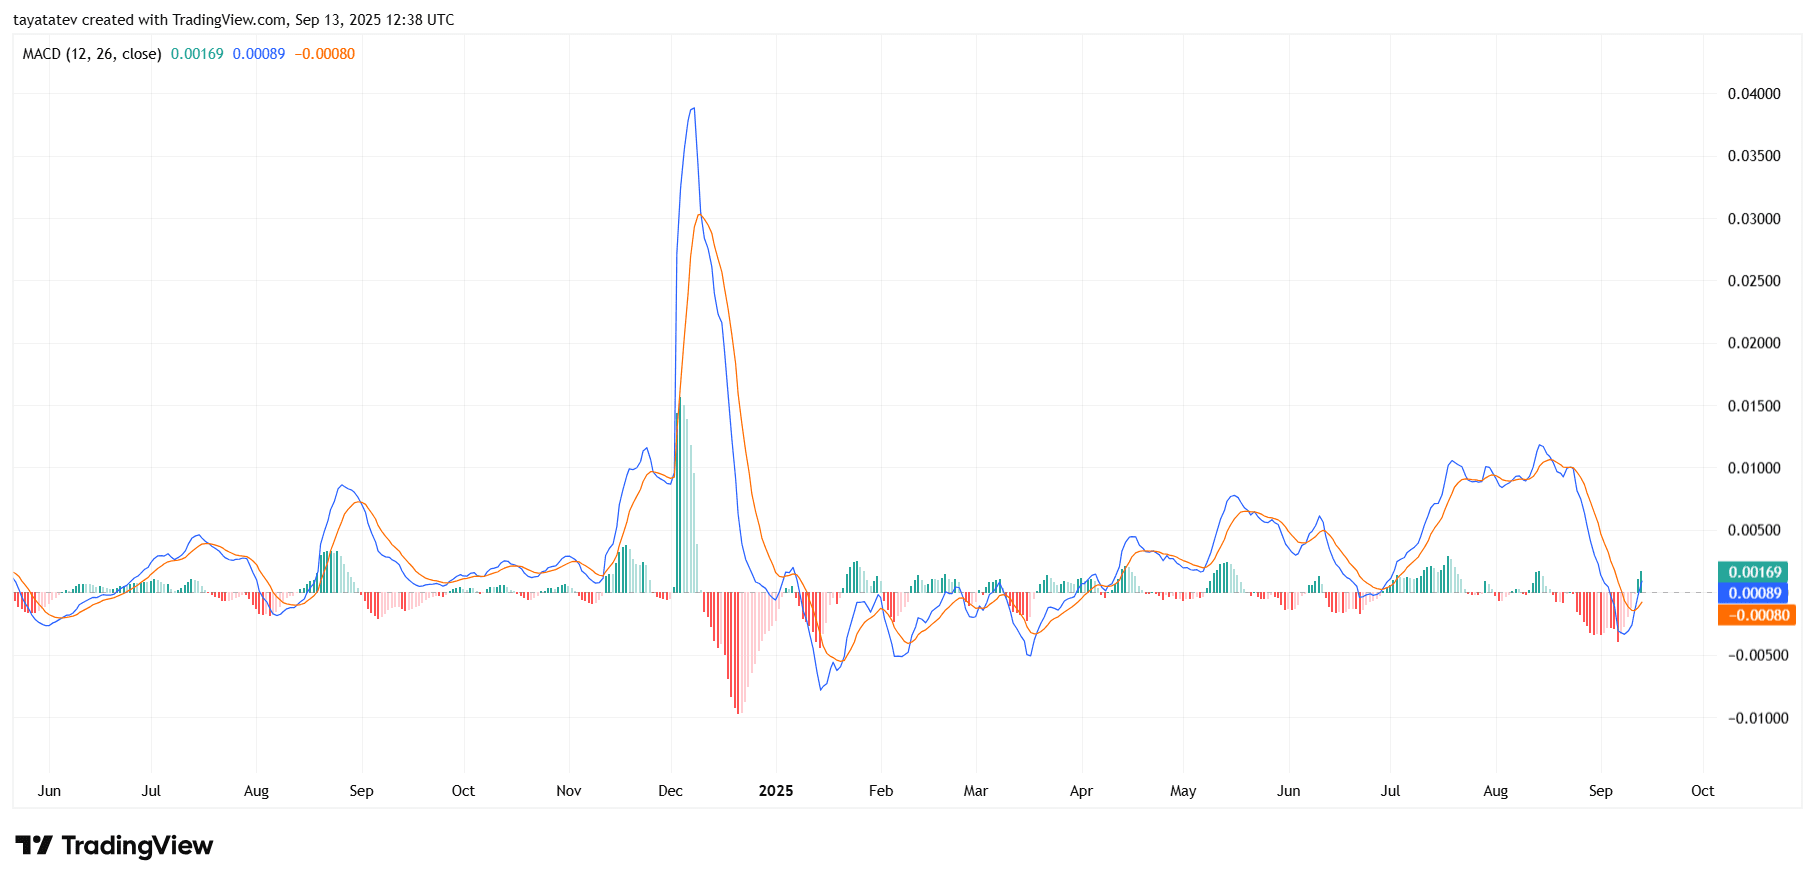
Through July and August, MACD rose to roughly 0.010–0.012 before rolling over. Early September then dipped below zero and briefly undercut the signal line. However, momentum flipped back up quickly, and the histogram bars turned green again. The signal line remains slightly below zero, which shows the upturn is still young on this daily look.
Context over the past year shows several wide swings. A sharp spike near 0.04 appeared in December 2024, followed by a deep trough around −0.01 in January 2025. Since then, amplitudes have been smaller and more cyclical. Summer 2025 showed repeated crossovers around the zero line, with brief positive bursts and fast fades. The current move resembles those mid-year rotations but begins from a cleaner reset after the early-September dip.
Zero-line behavior matters on this plot, and MACD now hovers just above it. If the line holds above zero, the histogram should stay positive while the signal catches up. If it slips back under, momentum would return to neutral. Price is not displayed here, so divergences cannot be confirmed, and this read reflects only the MACD path shown.