
Network revenues across public blockchains fell 16% month over month in September, according to a new VanEck report. The asset manager links the decline to calmer markets and fewer high-priority transactions. Analysts cite a thinner pipeline of urgent on-chain activity during the month.
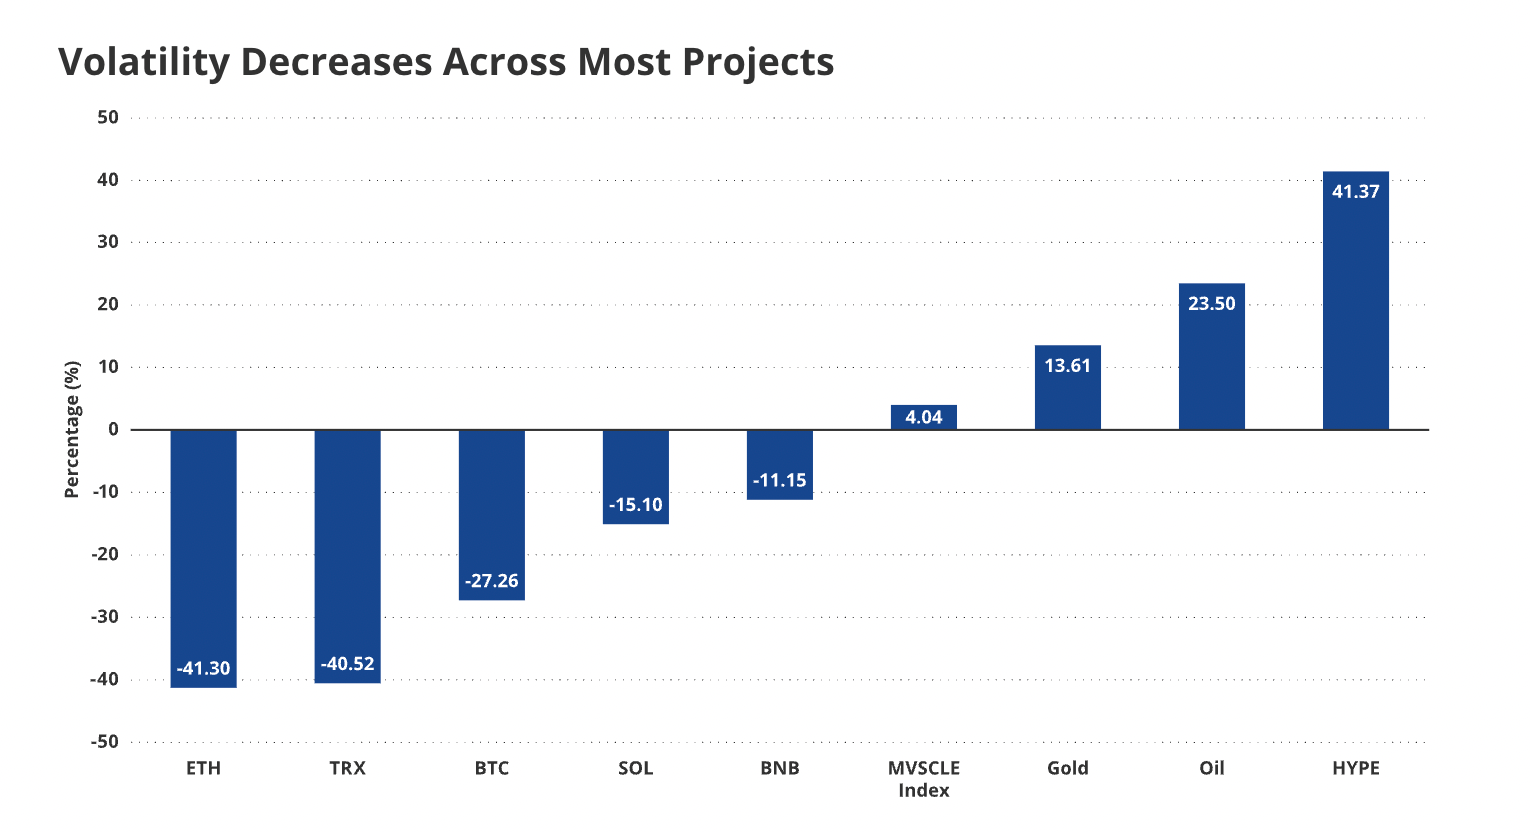
Volatility eased across major assets in September. Ether volatility dropped 40%, Bitcoin volatility fell 26%, and Solana volatility declined 16%. Lower realized swings typically reduce queue pressure for block space and shrink fees. That pattern fed directly into blockchain network revenues.
“With reduced volatility for digital assets, there are fewer arbitrage opportunities to compel traders to pay high priority fees,”
the VanEck report states.
Ethereum network revenue: smaller decline alongside lower crypto market volatility
Ethereum network revenue declined 6% in September, per the VanEck report. The month featured fewer time-sensitive liquidations and fewer rush transactions. As a result, users paid less to speed up confirmations on busy days.
The cooling backdrop matched the volatility data. Ether volatility fell by 40% in the same period. When prices move less, traders submit fewer max-fee bids to beat competition. That change trims Ethereum network revenue at the margin.
Yet Ethereum remains a top fee generator in absolute terms. Activity from DeFi, staking operations, and transfers persisted. However, calmer markets lowered priority bidding and cut total fees collected in September.
Solana network revenue: double-digit drop under softer priority bidding
Solana network revenue fell 11% month over month, the VanEck report shows. September brought fewer bursts of mempool competition. Consequently, average paid fees compressed across many days.
The move aligned with Solana’s 16% volatility decline during the month. Lower swings typically mean fewer opportunities for latency-sensitive trades. That shift reduces the number of transactions willing to outbid baseline gas.
Despite the pullback, Solana’s throughput stayed active. Transfers, consumer apps, and DeFi flows continued. However, the calmer tape cut premium bidding and reduced Solana network revenue for September.
Tron network revenue: sharp monthly impact, but yearly lead on stablecoin rails
Tron network revenue recorded a 37% reduction in fees for September. VanEck notes a governance proposal that reduced gas fees by over 50% in August. The August change carried into September and lowered fee intake.
Even so, Tron leads on a trailing-year basis. Token Terminal data lists $3.6 billion in Tron network revenue over the last 12 months. That figure places Tron at the top of the revenue table for the period.
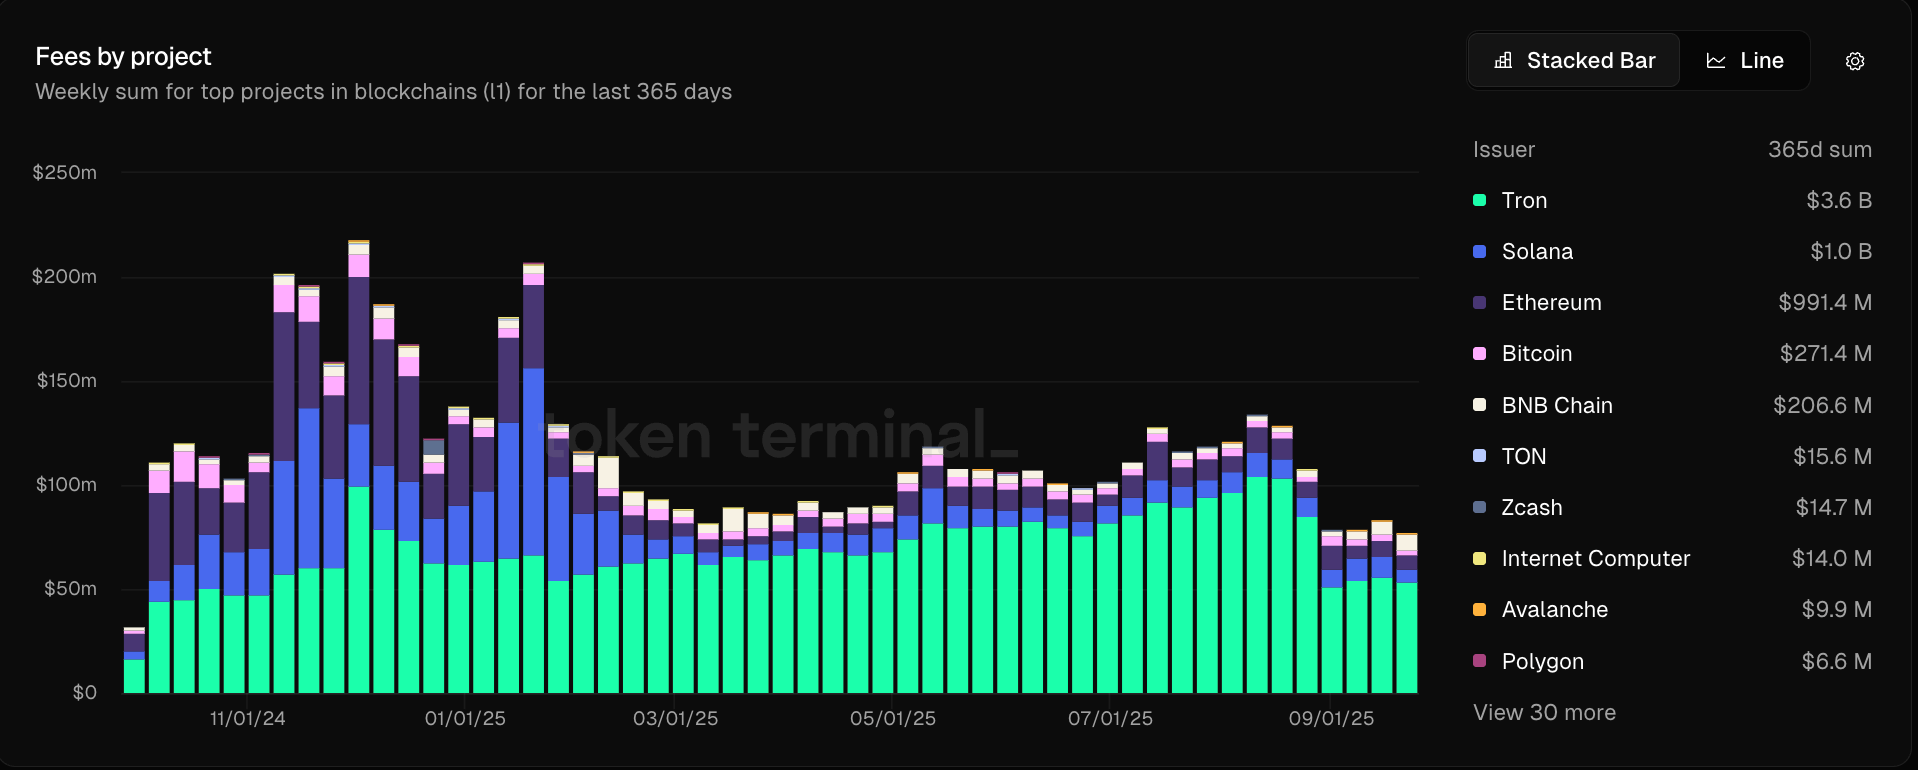
By comparison, Ethereum generated about $1 billion in the last year, per Token Terminal. This gap persists even with ETH near a $539 billion market cap. Meanwhile, TRX sits just above $32 billion. The difference reflects use-case mix and the structure of fees across ecosystems.
Stablecoin market cap and USDT flows underpin Tron’s revenue base
Tron’s lead ties to stablecoin settlements. About 51% of all circulating Tether (USDT) runs on Tron, according to the cited data. High-frequency transfers, remittances, and exchange movements keep gas usage steady.
The broader stablecoin market cap reached $292 billion in October 2025, per RWA.XYZ. The category has expanded since 2023. Growth in dollar tokens supports settlement demand even when trading cools.
This settlement layer helps explain Tron network revenue resilience over longer windows. Stable payments flow at all hours with near-instant settlement and low fees. That cadence sustains validator income even as crypto market volatility dips.
Fees, volatility, and what network revenues say about on-chain activity
Blockchain network revenues track the price users pay to settle transactions. When volatility climbs, arbitrage and liquidations rise. In those periods, users pay more for block inclusion, and fees increase.
September showed the reverse. With BTC, ETH, and SOL moving less, urgency fell. The VanEck report ties the 16% revenue drop to that softer environment. Fewer max-fee bids cleared, and average fees trended lower.
Market participants monitor network revenues and fees as core health markers. These metrics reveal demand for block space, settlement intensity, and application use. In September, each signal eased in step with calmer markets, as the VanEck report details.