
Intersect’s Board Election 2025 voting window closes today, Friday, Sept. 26, at 12:00 UTC. The organization reminded members about the cutoff and linked step-by-step instructions for casting ballots. Voting determines four of the seven board seats.
Moreover, Intersect’s recent development update flagged the open vote alongside a new GovTool version release. The post directed members to the live resources used during the election period. It emphasized process clarity and participation.
Finally, Intersect’s election hub outlines the September board contest within a broader governance season. Committee elections follow in October, keeping the cadence of community decision-making. The materials summarize scope, timing, and roles.
Cardano Days begins today in Laramie, Wyoming, and runs through Saturday, Sept. 27. The University of Wyoming’s event page lists hands-on sessions on Cardano fundamentals, smart contracts, and governance. Registration remains available for both days.
Furthermore, Input Output confirmed the dates, describing the program as a two-day, in-person learning experience. The note highlighted the focus on practical education across key topics.

The event sits within the Wyoming Blockchain Stampede schedule hosted by the university. Stampede materials show the broader festival window and campus venue details, while external listings provide location and agenda snapshots.
Cardano on Friday, September 26, 2025: bullish flag in focus
Daily setup and date context
Cardano’s daily ADA/USDT chart on Friday, September 26, 2025, shows price near $0.772. The move comes after a multi-week pullback inside a downward-sloping channel drawn from early September highs. Volume remains moderate compared with August spikes.
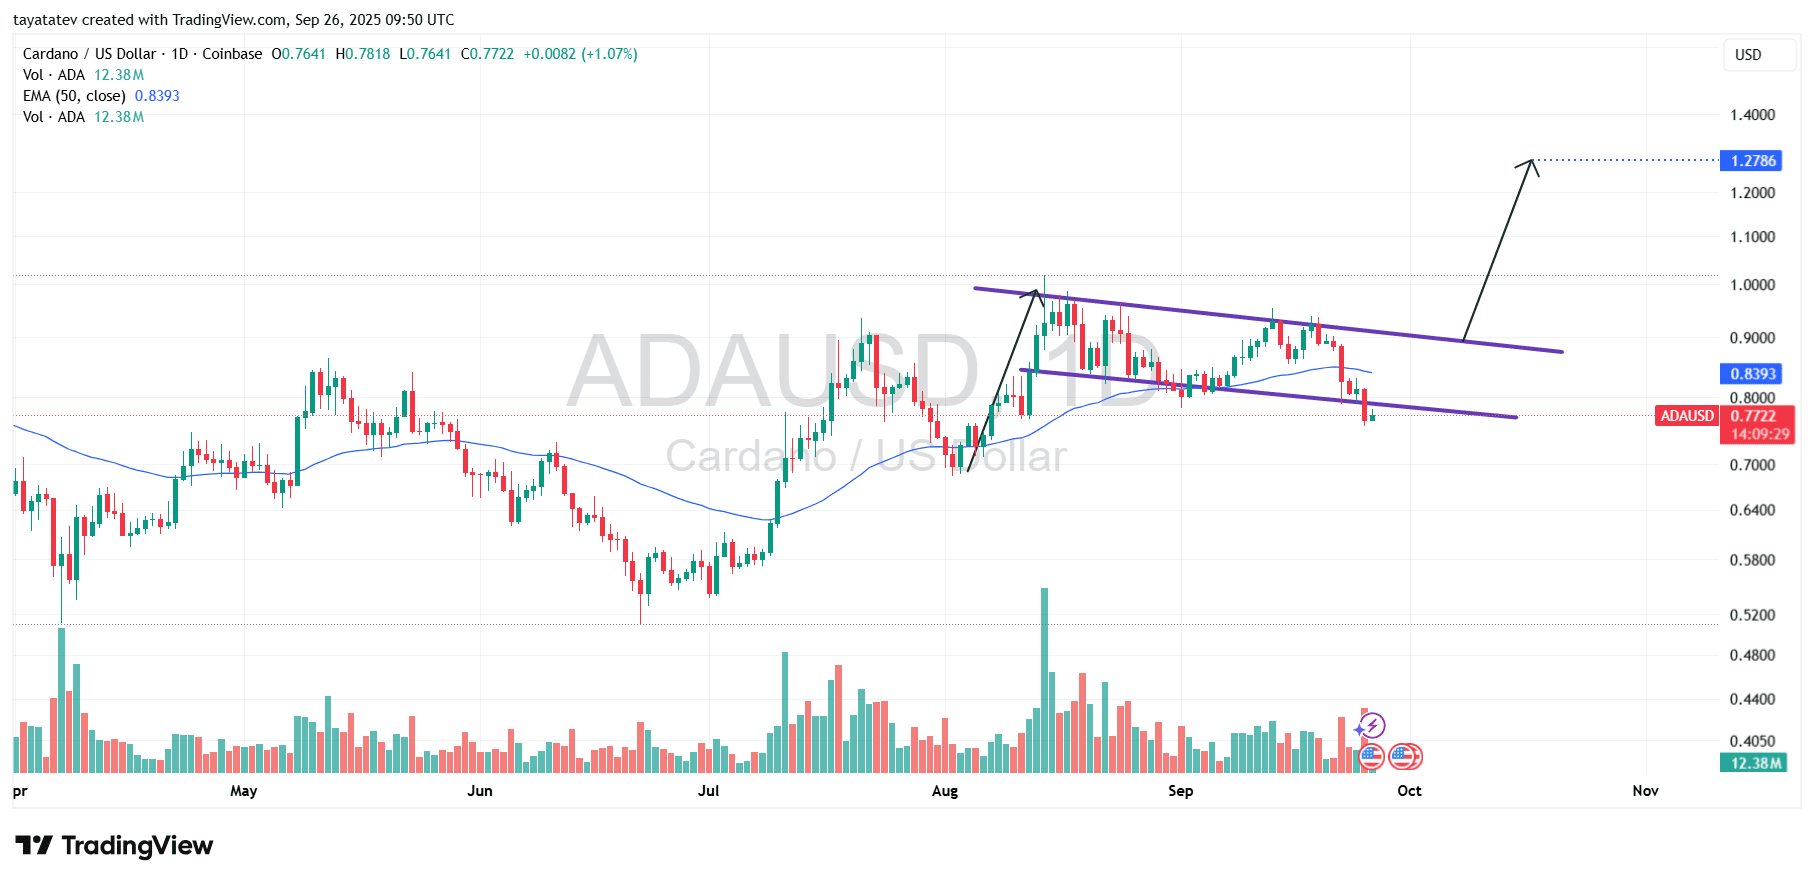
Moreover, the 50-day exponential moving average (EMA) sits near $0.839, above spot. That level, together with the round $0.80 area, forms the first band to reclaim for momentum. The upper boundary of the channel tracks just under $0.90 and marks the next structural hurdle.
Taken together, the layout frames a consolidation after July–August gains. It also sets the stage for a continuation pattern if buyers regain the channel midline and the 50-day EMA with conviction.
Bullish flag structure and behavior
The chart outlines a classic bullish flag: a sharp advance forms the “flagpole,” followed by a controlled drift lower inside parallel lines. The slope of the channel is shallow relative to the prior rise, which fits the textbook profile.
However, today’s candles show price leaking slightly below the lower guide of the flag. This kind of brief undercut is common during late-pattern shakeouts, especially when volume does not expand aggressively on the break. It does not invalidate the structure if price quickly rotates back inside the rails.
Therefore, watch for a swift return above the lower boundary and then a push through the midline. A daily close back over $0.80, followed by traction at the 50-day EMA around $0.839, would signal that the pattern has resumed constructive behavior.
Measured move and 65 percent target
Flag targets typically mirror a portion of the flagpole’s height projected from the breakout zone. Using today’s spot price as the working base, a 65 percent advance implies a destination near $1.27. Calculated precisely, sixty-five percent above $0.772 is about $1.274, which aligns with the technical objective drawn on the chart.
In practice, a reclaim of the channel and a break toward the $0.90 region would open room to the measured band. Subsequent validation would come from higher highs and supportive volume as price approaches the one-dollar handle and beyond.
Until then, risk pivots near the recent lows just under the lower rail. Regaining the $0.80 area, then the 50-day EMA, keeps the bullish flag thesis intact and preserves the path toward the $1.27 zone.
Cardano’s daily RSI (14) reads 37.04 today, below the neutral 50 line and under its RSI average near 49.70. This placement signals weak momentum, not capitulation, because the gauge still holds above 30. In news terms, pressure persists, yet conditions have not reached classical oversold.
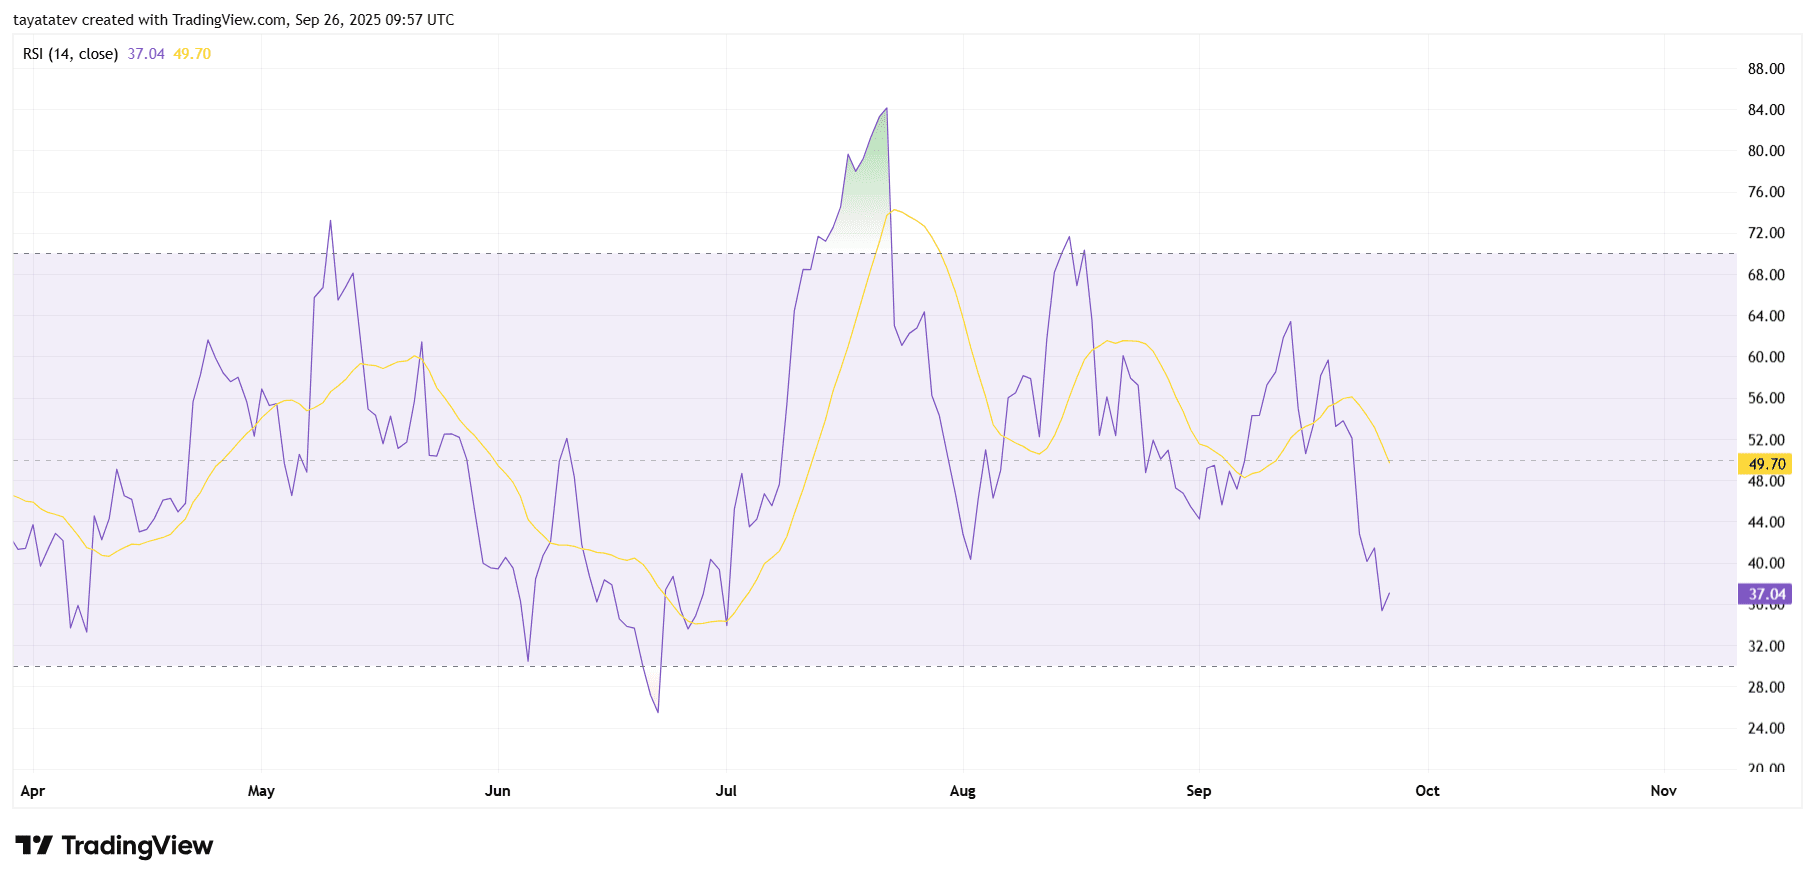
Now the explanation. RSI measures how quickly price gains or loses over the last 14 sessions. Values below 50 show sellers control the short-term pace; values near 30 often mark exhaustion. Because RSI sits in the 30s, bears lead but have not forced a washout. The gap between the RSI (37.04) and its average (about 49.70) also tells you momentum is lagging trend. Therefore, rallies can fade until the purple line crosses back above the yellow average.
Next, context. In July, RSI pushed above 70 as price surged, then rolled over through August and September. That sequence created lower RSI highs, which matches the consolidation on the price chart. Today’s reading continues that drift. However, the recent downswing has started to slow, which you see as smaller RSI bars and a gentler slope. If RSI turns up through 40–45 first, it would indicate sellers are losing pace before any breakout attempt.
Finally, what to watch. A climb back over the RSI average and then past 50 would align with a constructive shift and often precedes upside follow-through on price. Conversely, a clean break below 30 would mark stress and usually triggers only short, reflex bounces unless RSI quickly reclaims the 30s. Until momentum repairs, price rallies face a higher bar to sustain.
Cardano MACD on Friday, September 26, 2025
Cardano’s daily MACD (12, 26, 9) registers below the zero line, with both the MACD and the signal line around negative 0.016. This placement confirms bearish momentum on the daily timeframe. Moreover, the histogram prints red bars below zero, which shows downside pressure building after a recent bullish attempt stalled.
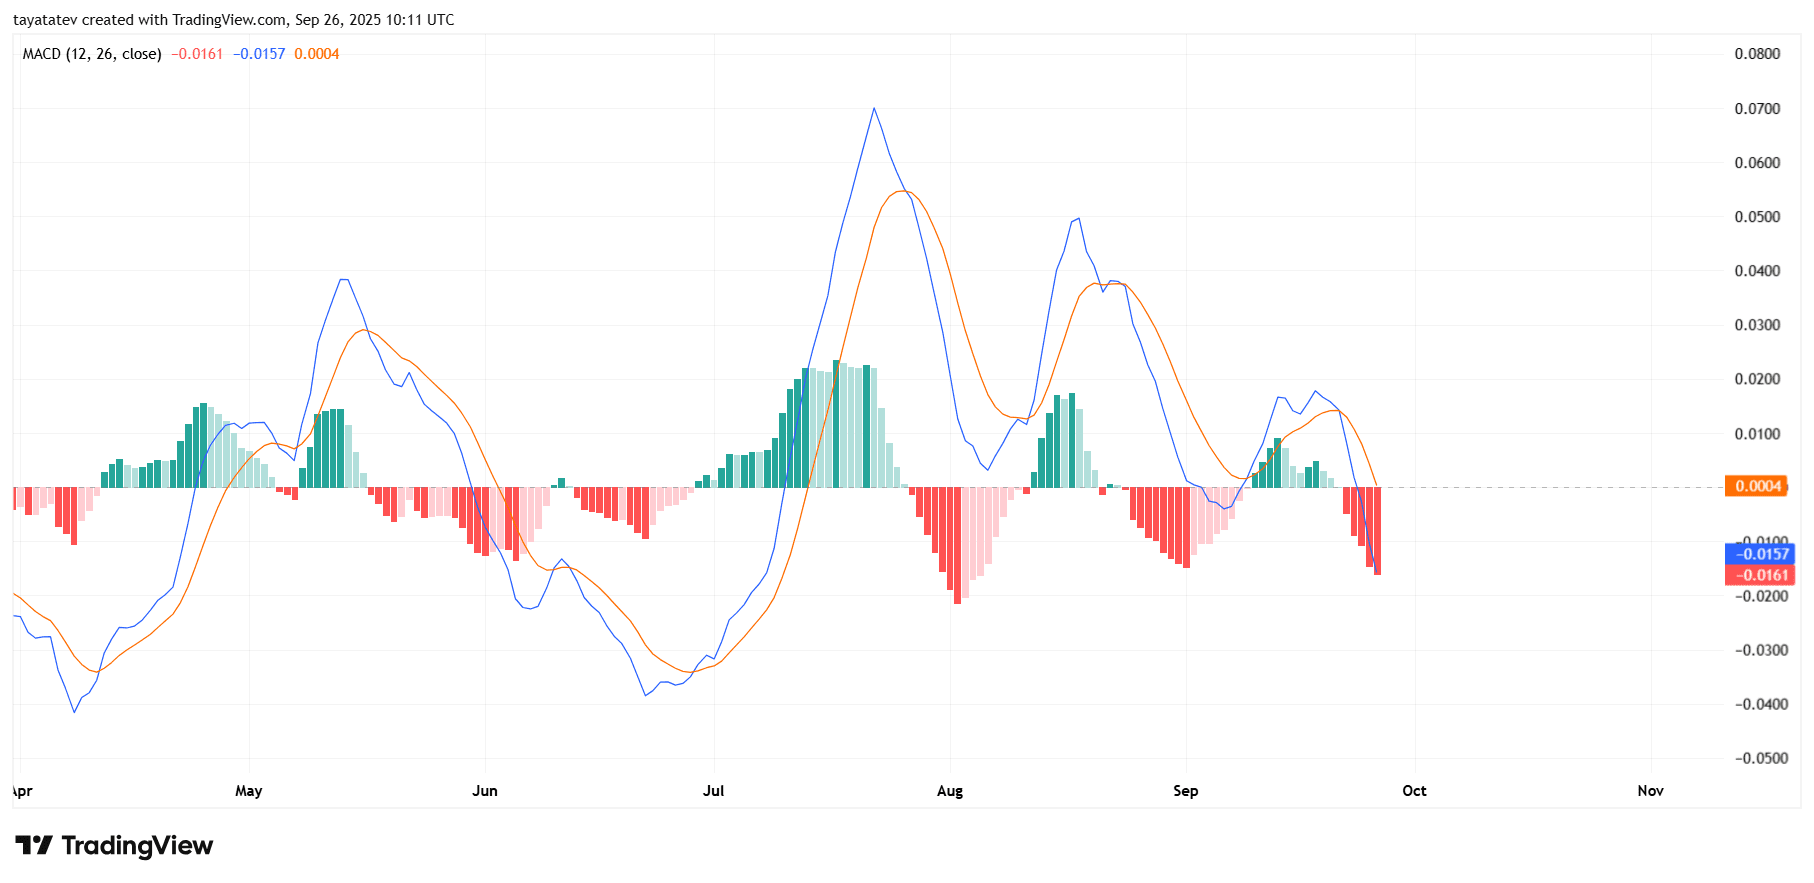
However, the gap between the MACD and the signal line remains narrow. When that spread compresses near the zero axis, markets often prepare for a momentum inflection. Therefore, if the histogram starts to rise toward zero and flips to light green, it would indicate that selling power is fading before any price recovery.
Until then, the current alignment favors defensive conditions. A daily cross of the MACD back above the signal line, followed by a climb through the zero line, would shift the tone to constructive and would likely align with price reclaiming nearby moving averages on the main chart. Absent that sequence, rallies can fade as the negative histogram persists.