XDC Network moved to strengthen its position in global trade finance by acquiring the Contour platform. Contour previously connected major banks and corporates through a shared digital environment for Letters of Credit, but the network went inactive earlier this year. XDC plans to revive the platform and align it with its settlement layer, creating a full workflow from documentation to transaction finalization.
The goal is to reduce dependence on slow paper-based processes, which continue to dominate cross-border trade. By integrating Contour with blockchain rails, XDC intends to offer automated document handling and verifiable audit trails, giving trade participants a faster path from agreement to settlement. The update also signals that XDC will focus on enterprise adoption rather than retail narratives.
As the relaunch progresses, the team expects corporates and banks to onboard through a familiar interface, while the underlying settlement shifts to blockchain. This approach allows institutions to adopt the tech without altering their operational habits, which has historically been one of the biggest barriers to trade-finance digitization.
Stablecoin Settlement and RWA Programs Build Supporting Infrastructure
Alongside the Contour move, XDC ecosystem participants highlighted stablecoin-focused development tied to trade finance. The initiative aims to connect tokenized documents, tokenized credit instruments, and on-chain settlement into one system. As a result, trade agreements, financing, and payment finalization could take place on a single infrastructure layer instead of fragmented platforms.
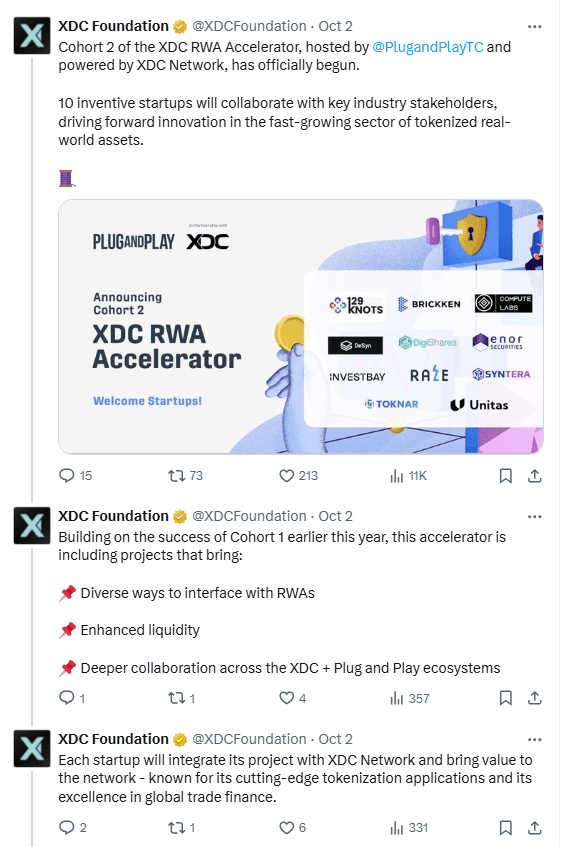
Additionally, the ecosystem’s RWA accelerator continued to promote real-world asset onboarding. The program focuses on startups building tokenization products that match XDC’s enterprise theme. With more financial instruments moving on-chain, settlement and documentation rails become more valuable, giving the Contour integration clearer strategic context.
PrimeFi’s expansion to XDC also added another component. By supporting lending and borrowing, the platform gives the network additional liquidity tools that can support tokenized trade instruments in later stages. Together, these developments form parallel pillars: documentation, settlement, tokenization, and liquidity.
Institutional Visibility Grows Through Euronext Amsterdam Event
XDC also appeared in traditional finance circles as representatives rang the bell at Euronext Amsterdam to highlight an exchange-traded product tied to the network. While symbolic, the ceremony increases the project’s visibility in institutional channels and reinforces its narrative around regulated financial participation.
The event brought XDC’s trade-finance message to a European market that has already shown interest in tokenized securities and blockchain settlement systems. By placing trade-focused messaging in front of traditional players, the network continues pushing toward legitimacy among regulated entities rather than consumer speculation.
The bell-ringing aligned with the week’s broader theme: XDC wants to be seen not as a retail-driven network, but as financial infrastructure capable of supporting banks, tokenized settlement instruments, and cross-border transactions.
XDC Targets Major Breakout as Monthly Fibonacci Levels Signal Long-Term Upside
XDC/USD monthly chart shows a long consolidation phase followed by a potential breakout structure, with Fibonacci extension levels marking the next major targets. The chart highlights three key zones: the 1.618 level near $0.19, a higher extension zone around $0.85, and a long-range target near $3.20. The price has held its macro range since 2021, forming a base that often precedes expansion moves on higher timeframes.
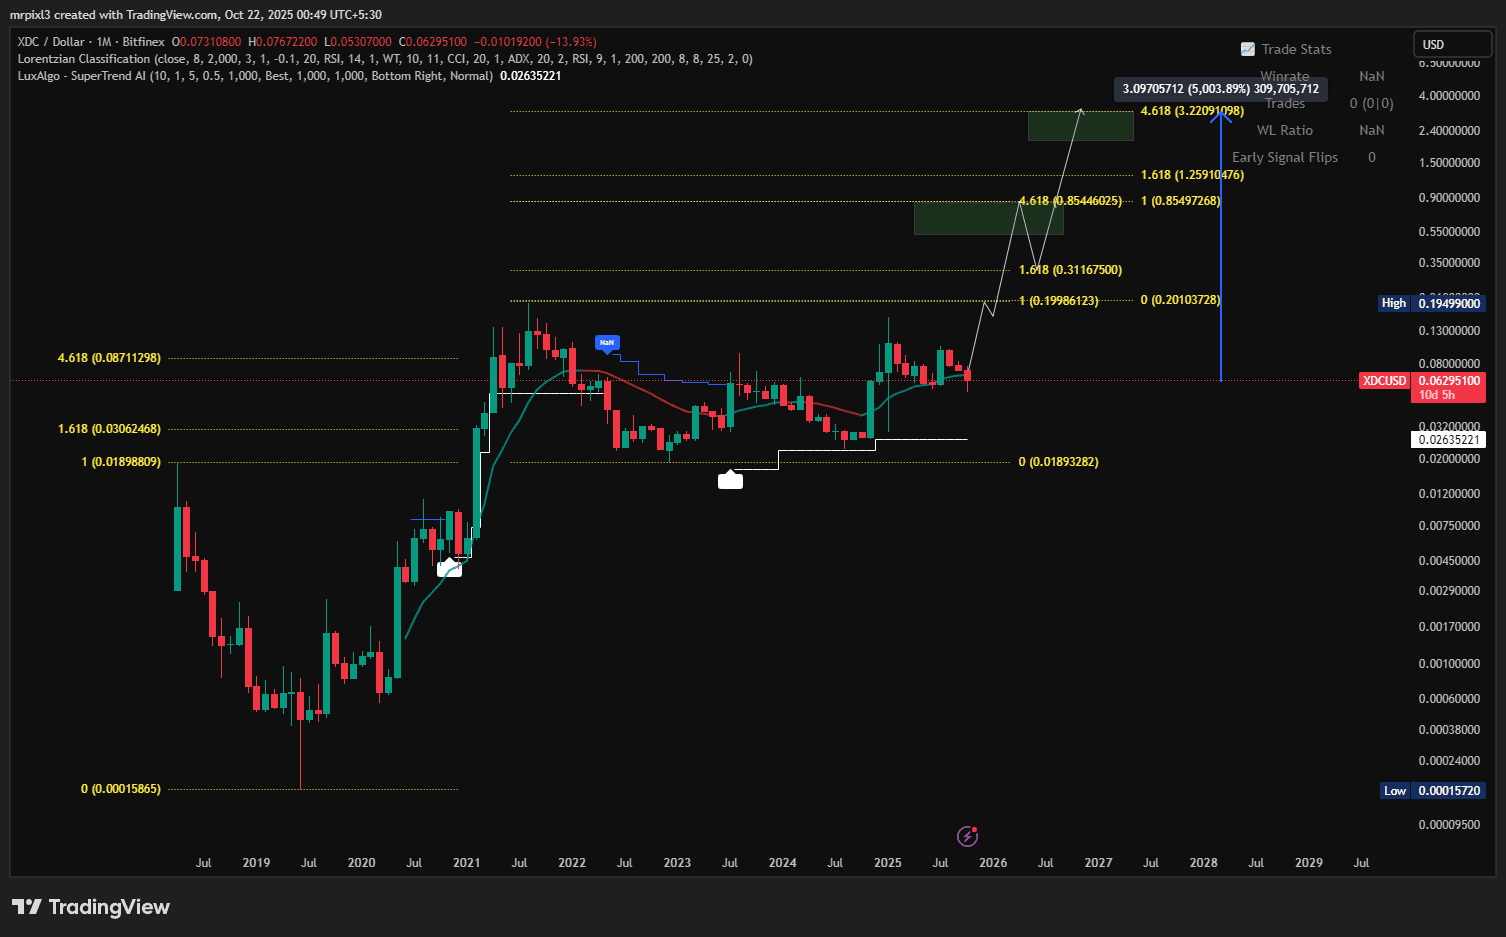
The consolidation suggests that market makers have compressed volatility, allowing demand to build within a narrow structure. As the chart shows, XDC previously exceeded the 4.618 Fibonacci level during its last major rally, confirming that the asset has a history of impulsive extensions once it enters price discovery. Therefore, a break above the current range could trigger a sustained move rather than a short-lived rally.
Momentum indicators on the monthly timeframe show that buyers have defended higher lows, keeping the long-term trend intact. If price acceptance forms above the range high, the chart projects a gradual path toward the Fibonacci target zones, beginning with the $0.19 area as the first major confirmation level. From there, the structure leaves room for a higher advance in later stages of the cycle.
Fundamental Narrative Fuels Long-Term Thesis
XDC is framed as trade-finance infrastructure, not a speculative payments token. The thesis places it in “PayFi.” XRP targets institutional settlement. XLM focuses on retail payments. XDC specializes in tokenized trade instruments. Therefore, it fills a distinct role instead of fighting broader chains head-to-head.
Demand, the post argues, could come from tokenized invoices, bonds, and RWAs. Builders on XDC would drive that flow. Stablecoin rails and asset integrations would reinforce it. Trade finance is measured in tens of trillions each year. So XDC aims to plug blockchain into existing institutional workflows.
The fundamentals center on throughput, low fees, and a hybrid design. Those traits suit regulated settings. They also support a long-term, adoption-led case. If usage grows, macro demand—not pure speculation—could power expansion over time.
XDC monthly RSI shows a stable base, but momentum must reclaim its signal
The monthly RSI prints ~50.7 while its signal sits near 55.8. That keeps momentum above the 50 midpoint, which supports a constructive base. However, because RSI is below its signal, near-term impulse lags. The indicator recovered from 2023 lows, briefly reached the high-60s in early 2025, then cooled without breaking 50—so the longer trend bias remains intact.
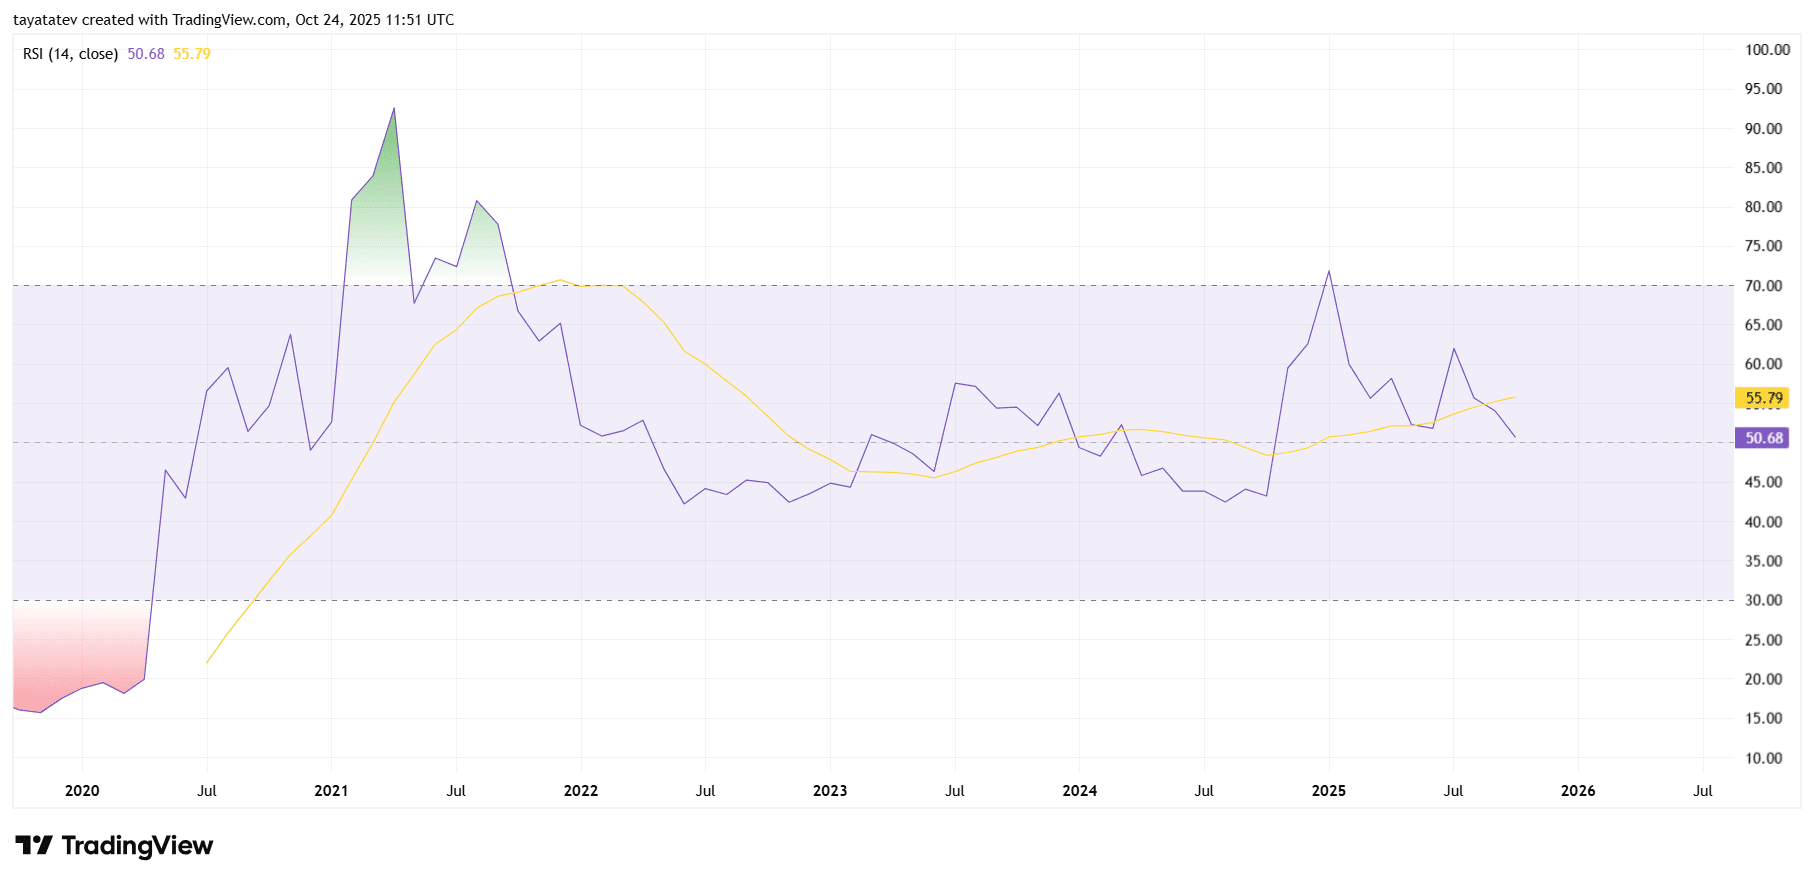
Context still favors base-building. Since 2021 the oscillator has mostly lived between 45–65. Within that band, >60 marks expansion, 50–55 marks neutrality, and <45 warns of deterioration. Today’s level sits in the neutral zone, with higher lows on the oscillator since 2023 suggesting pullbacks have been corrective rather than trend-ending.
Forward, the triggers are clear. A monthly RSI close back above the signal (≈56–58) would realign momentum with bulls; sustained readings >60 would confirm expansion consistent with breakouts. Conversely, consecutive closes <50 would weaken the base and raise risk of a deeper, time-based correction toward ~45 before stabilization. Until a trigger fires, expect sideways-to-up drift rather than strong thrust.