
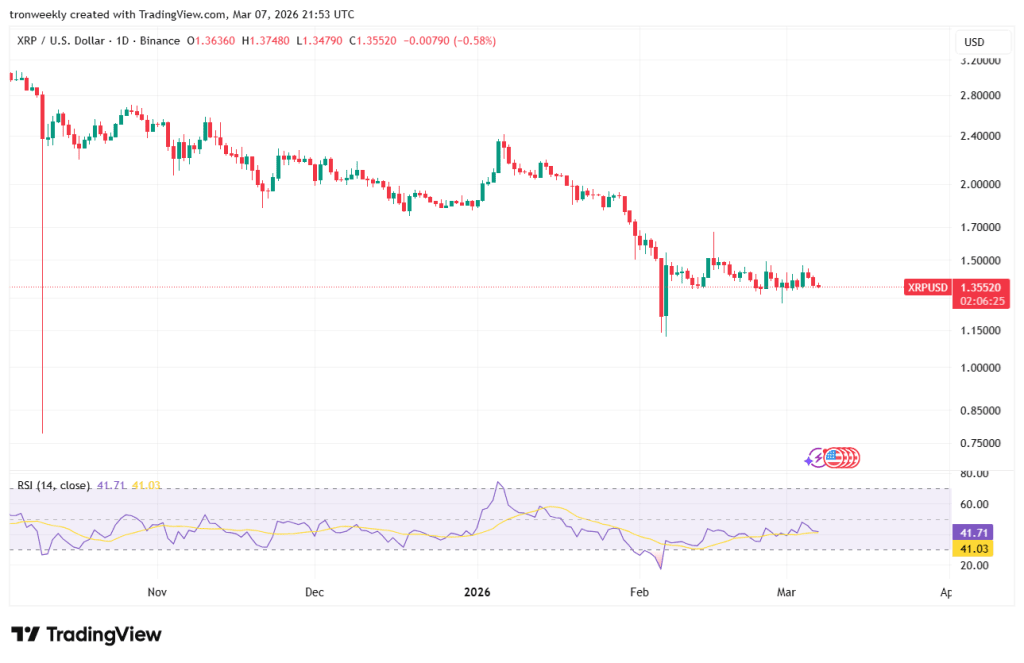
XRP is currently navigating a well-defined downward channel against the U.S. dollar, trading near $1.35. Based on the trading charts from TradingView, the general trend of the price movement has been bearish since the end of November.
There are lower highs and lower lows, which indicate that the price movement is going down. This shows that the price movement is being supported by the buyers, but it is still being dominated by the sellers.
In this larger trend, XRP has created a small consolidation pattern following a strong drop in early February. The asset has been attempting to rise from around $1.20-$1.25 but has been unable to sustain these gains.

The resistance around the top of this small trading range has kept selling pressure high, preventing any rallies from sustaining. The key support is around $1.21-$1.22, and breaking below that could accelerate any further correction towards $1.10 or even $1.00.
The momentum indicators, including the asset’s Relative Strength Index, which is around 41, reflect an uncertain market with selling pressure slightly stronger but not overly so.
Also Read: XRP Price Outlook for Q1: Is the Market Building Toward a Potential New All-Time High?
XRP Historical Patterns Point to Potential Breakout
Looking at the long-term chart, the price of XRP has the tendency to form large symmetrical triangle consolidations, and after that, the price makes sudden and strong movements upwards.
On March 7, expert Javon Marks said that the present setup looks like the 2017 cycle, which means the recent correction could be a temporary one before the big bullish run.
In the previous cycles, XRP had long consolidations in which the prices traded in a squeeze between lower highs and higher lows.
When the prices dipped a little towards the support, the persistent sellers got stuck in the prices, and the large investors absorbed the available shares before a large up-move in the prices.

In the period between 2014 and 2017, this resulted in a 2,000% move in the prices, making XRP touch a high of $1.24. However, in the period between 2018 and 2024, XRP had the same pattern, forming lower highs and higher lows.
Long-Term Projections Suggest Aggressive Gains
As can be expected from past cycles, XRP is currently consolidating in a range of $1.30 to $1.40. It’s possible that this may be a new accumulation phase before a new run.
Technical projections show that, following past cycles, XRP could see a lot of growth, with estimates showing that, theoretically, it could reach as high as $90 in the long run. These are based on the percentage increases seen from previous breakout cycles.
While the level will vary depending on the market conditions and will be uncertain, the repetitive pattern of consolidation, false breakdowns, and breakouts above resistance levels indicates the potential for large price movements for the XRP.
The levels around $1.47 to $1.56 will be of particular interest to the traders, as a breakout through this level will indicate the beginning of a strong price rally.
Also Read: XRP Crashes Below Realized Price As Bears Take Control