

Ripple’s XRP price continues to float around a vital support level on Tuesday, March 3. This indicates a possible stabilization of the market.
Jonathan Carter, the crypto analyst on X, pointed out that the particular level has traditionally been a robust support level and is therefore significant for traders who anticipate a possible reversal.
A confirmed bounce here could open the door to multiple upside targets. Key levels to watch include $1.50, $1.80, $2.35, $2.70, $3.10, and $3.55, each representing historical resistance or Fibonacci retracement zones.
Hitting these points could attract momentum traders while testing broader investor confidence in Ripple’s recovery trajectory.

Source: Jonathan Carter’s X Post
Despite the potential for gain, risks are also high. If the price breaks decisively below $1.25, the bullish argument will be negated, and the price could continue to move lower in the descending channel pattern.
Price movements should be watched carefully to find potential entry points and risk management opportunities.
Also Read: XRP Face-Melting Phase Ignites: Traders Eye $17+ Explosion
XRP Technical Outlook Highlights Cautious Optimism
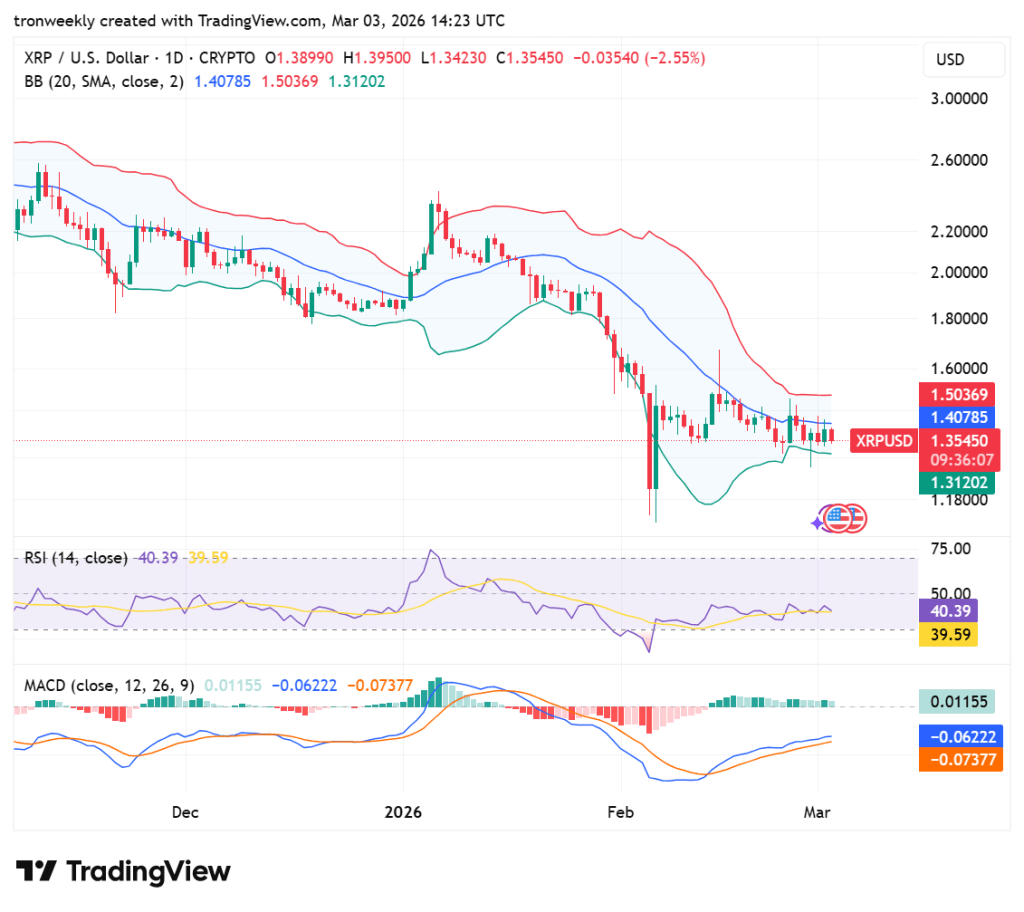
According to TradingView, as of Tuesday, March 3, XRP price fluctuations have been characterized by intermittent spikes since the end of December 2025.
From the use of Bollinger Bands (20, 2), it can be noted that the price of XRP has generally remained close to or even below the middle SMA line, where the lower band is $1.31202, suggesting proximity to support and slightly compressed volatility.
The current reading of the RSI (14) is at 40.39, which is just slightly above the oversold level of 30. This indicates a small movement towards the previous lows.
However, the reading is still very weak. The recent crossover over the moving average of the RSI, which is at 39.59, indicates a small bullish move.
Source: TradingView
The MACD indicates a persisting negative trend with signs of convergence. The MACD is at -0.06222 and is still below the signal line at -0.07377. This indicates a bearish trend.
The small size of the histogram at 0.01155 indicates a decline in the rate at which the price is falling. XRP is undergoing a consolidation phase after a sharp fall.
Also Read: XRP Stuck in Broadening Triangle: Can Bulls Reclaim $1.50 Again?