
Crypto analyst Ali Martinez reported a TD Sequential buy signal on XRP’s 4-hour chart. His TradingView image, time-stamped Sep. 20, 2025, 07:00 UTC, shows the Binance XRP/USDT perpetual with a completed “9” count and an arrow near 3.03. The final candle on the chart closed around 3.0050 USDT after trading between 2.9858 and 3.0050.
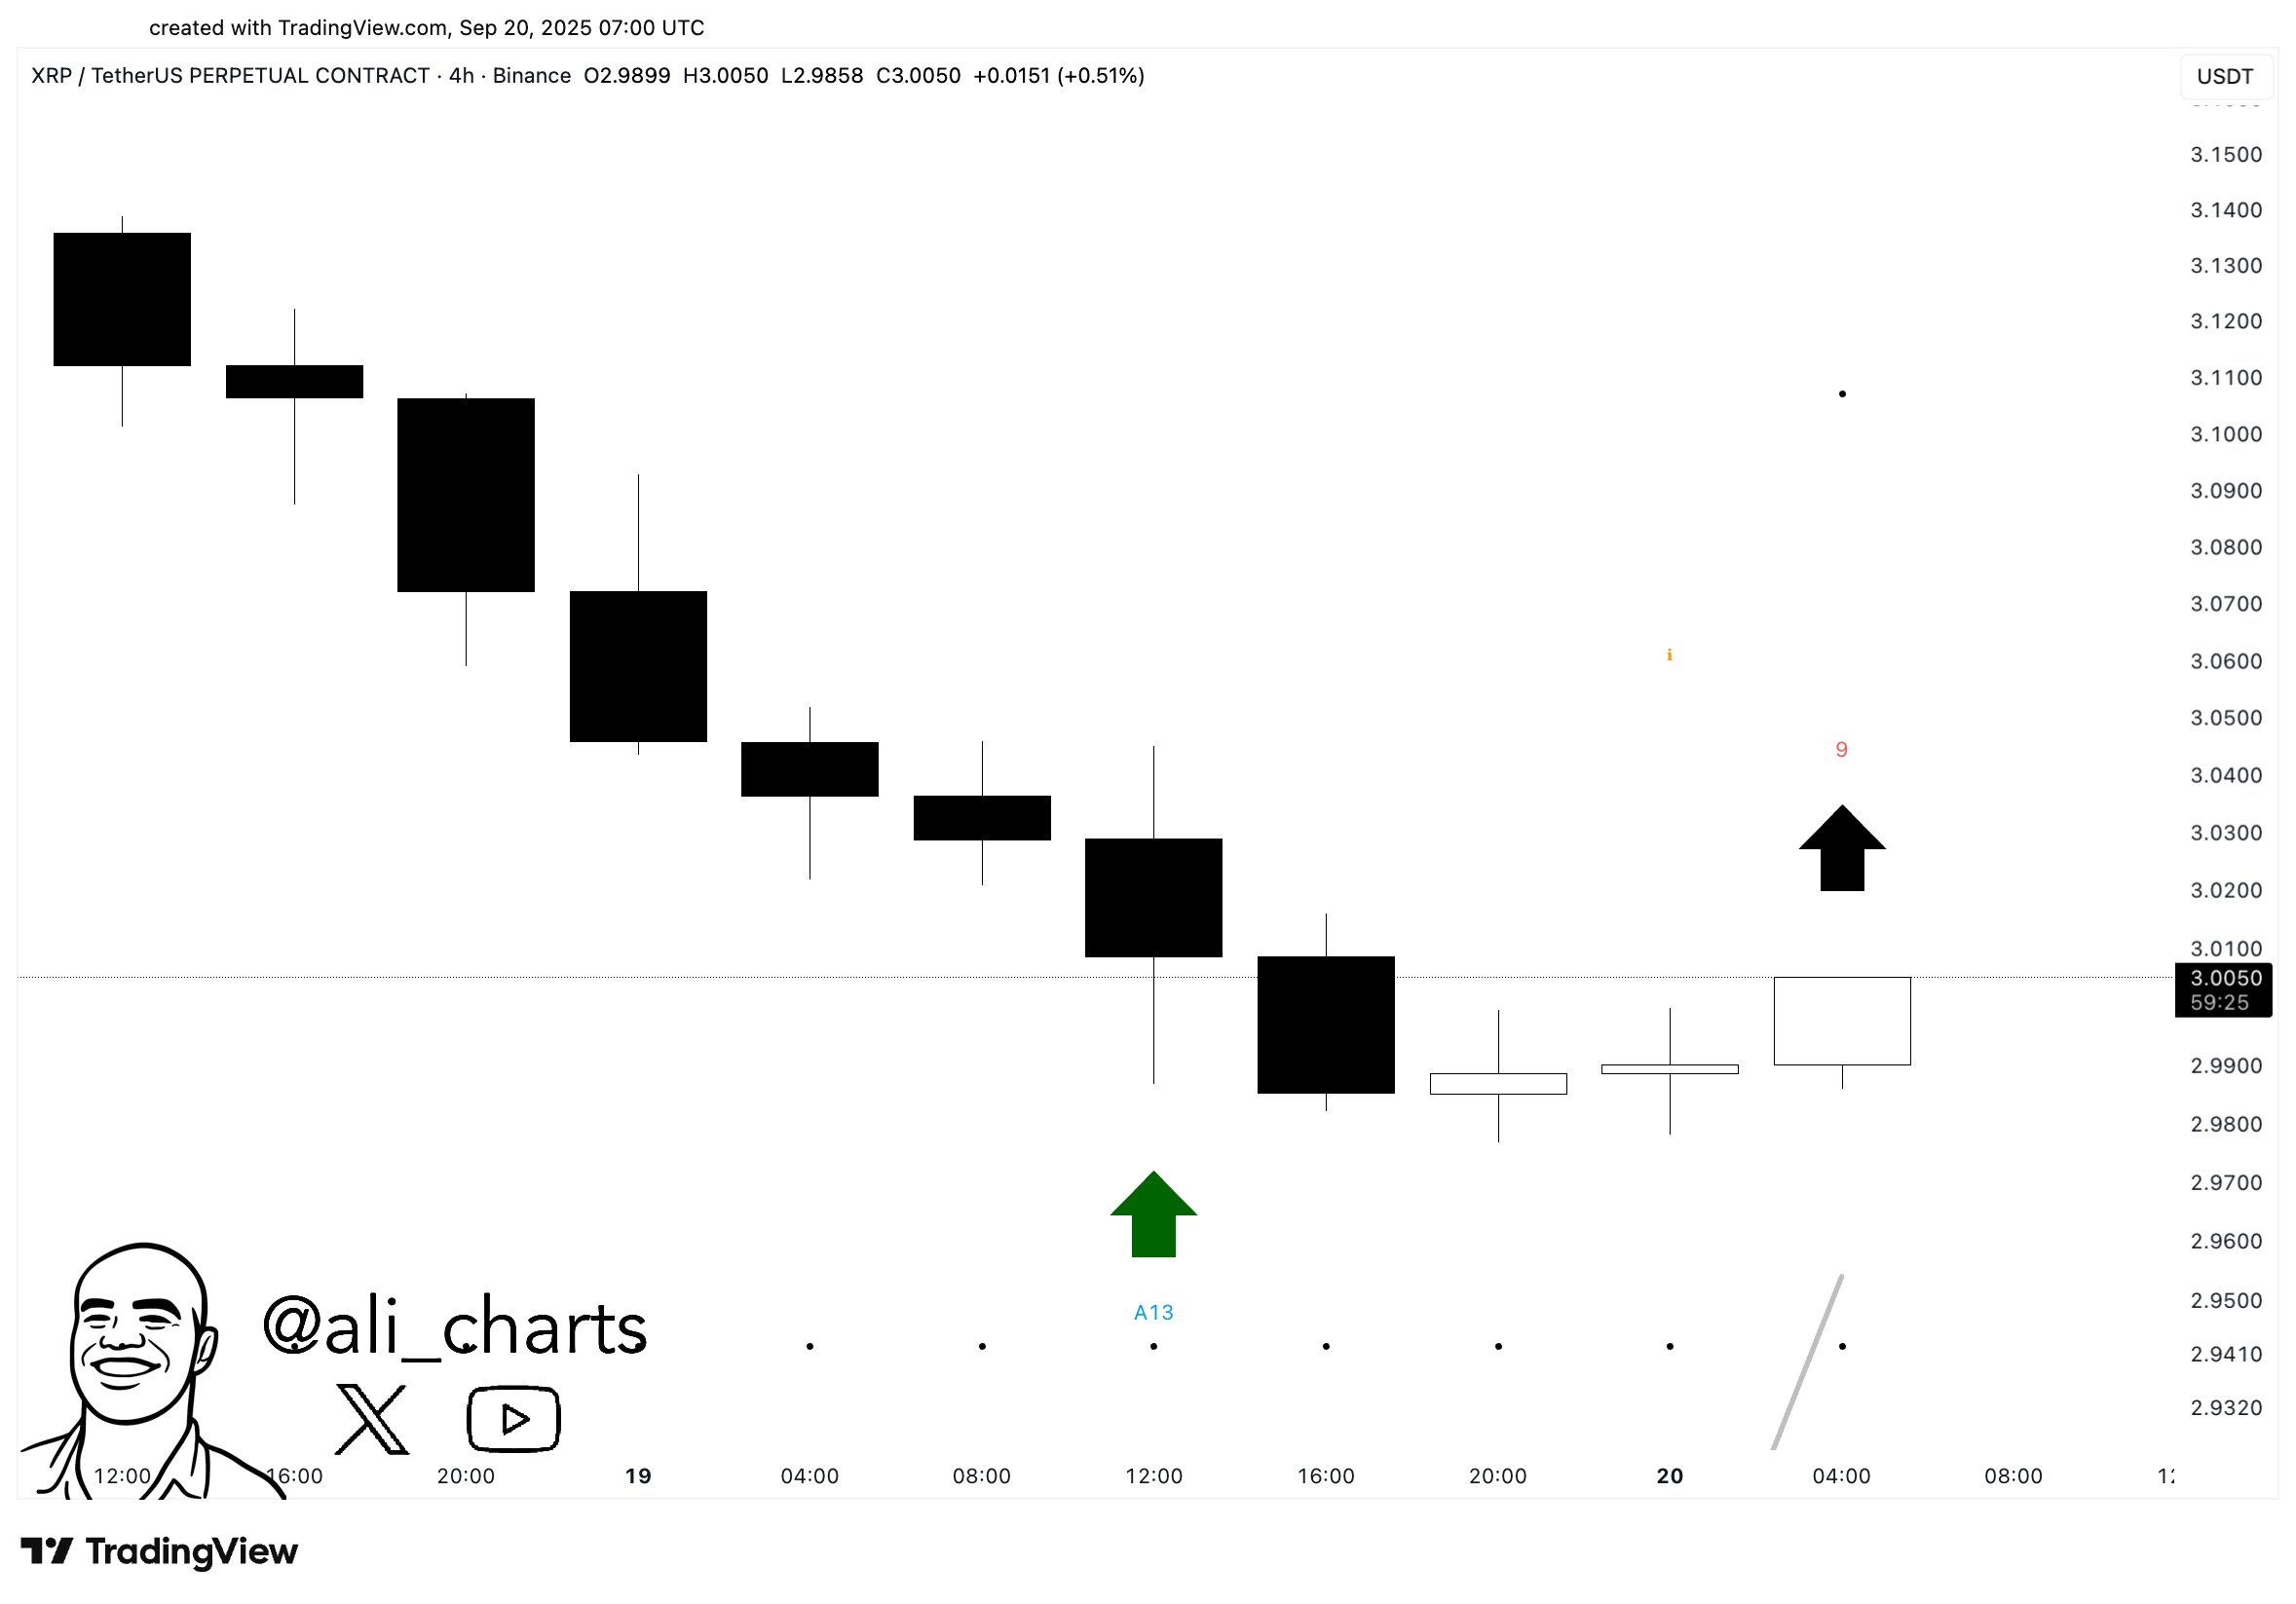
The TD Sequential model flags seller exhaustion after nine consecutive bars close lower than four bars earlier. Confirmation typically comes when a following bar closes above the prior bar’s high; breaks below the bar-8/9 lows often invalidate the setup.

Martinez’s chart depicts a steady decline into the “9,” then lighter candles suggesting stabilization. As with any trend-following context, traders usually wait for confirmation on subsequent bars before treating the alert as actionable.
Crypto analyst Jason Krypto said XRP remains bullish on the 4-hour chart despite a short-term pullback. His TradingView image, time-stamped Sep. 20, 2025, 11:17 UTC, shows a breakout above a two-month descending trendline, followed by a minor down-sloping channel. He adds that price may revisit the $2.90 area before any further advance.
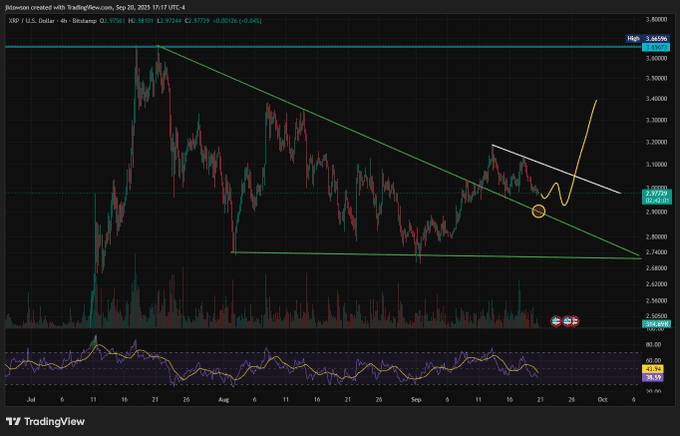
The chart plots a clean breach of the primary downtrend with a subsequent drift lower toward prior breakout levels. Volume appears subdued after the break, while the RSI cooled from recent highs toward neutral, which often accompanies retests. The drawn path suggests a dip into former resistance turned support, then a rebound, keeping the breakout structure intact if the retest holds.
XRP’s dailyXRP/USD chart on Bitstamp shows a sharp July advance that paused inside a downward-tilting channel, while candles now compress near the upper boundary around the low-$3 area and sit above the 50-day Exponential Moving Average (EMA) at $2.958. A bullish flag is a continuation pattern where price surges in a near-vertical “pole,” then consolidates inside a gentle, downward-sloping channel before attempting to continue higher. Here, volume cooled through the flag as expected, and the moving average under price signals support as the market works through the consolidation.
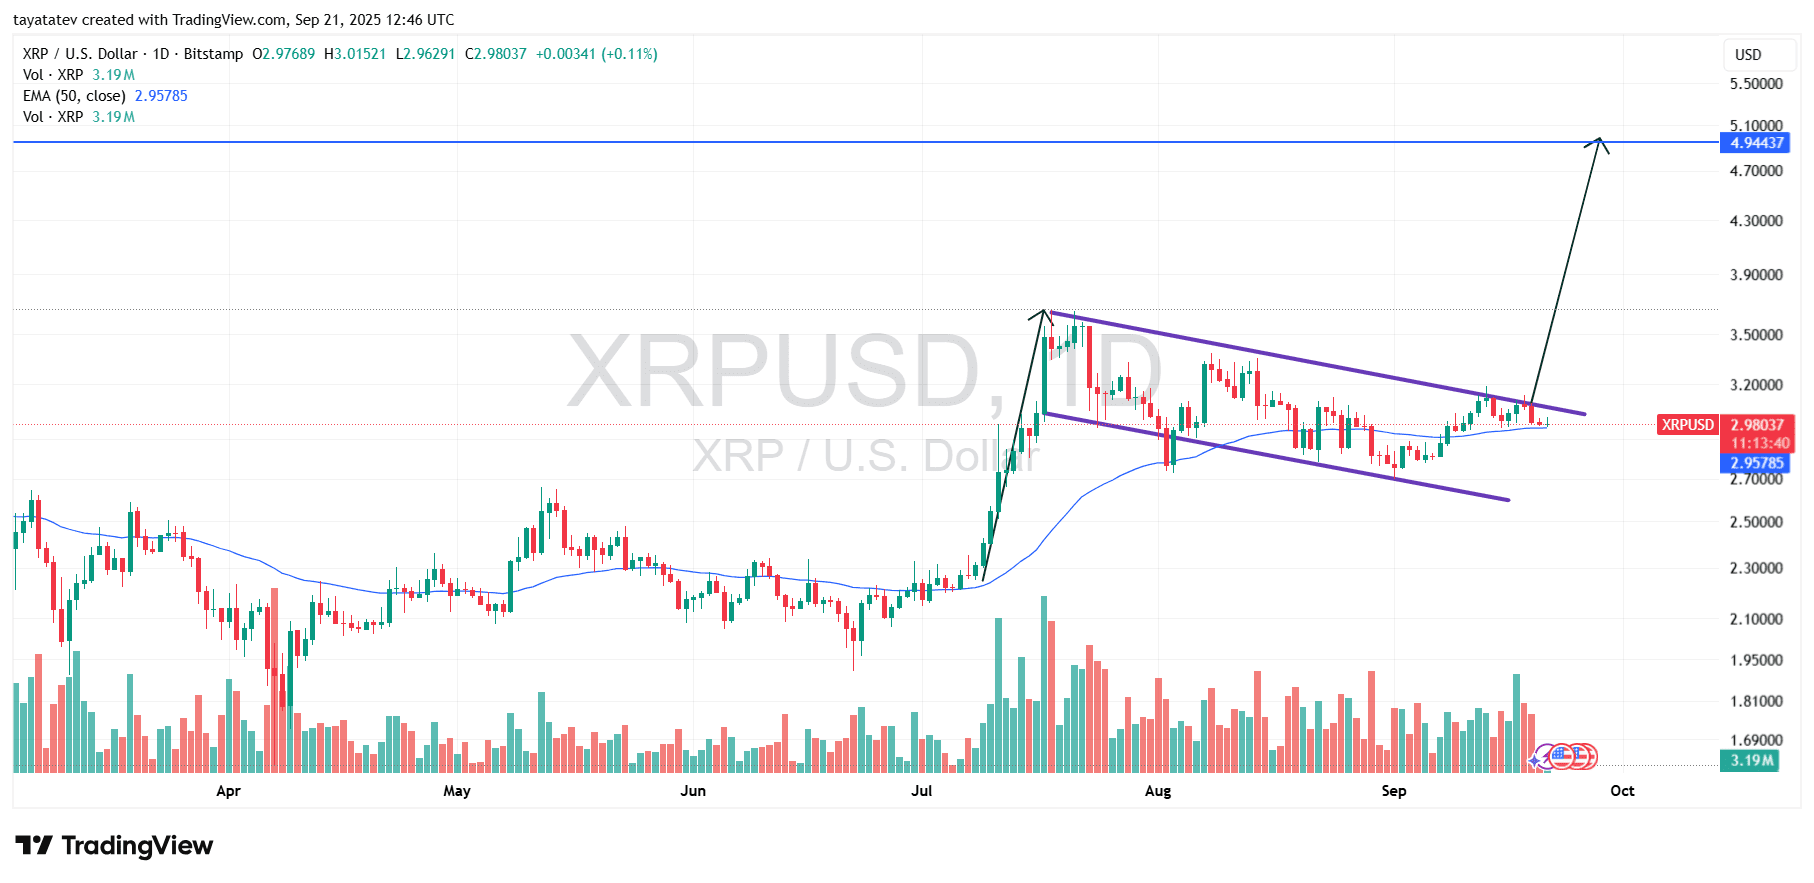
The setup turns actionable only if buyers force a decisive daily close through the flag’s topside trendline with expanding volume. Until that break, the structure remains a watch, not a trigger. However, if XRP confirms the breakout, the measured move from the flag projects about 66% above the current price near $2.98, placing a target around $4.95, which aligns with the horizontal level drawn on the chart.
XRP’s daily Moving Average Convergence Divergence (MACD 12, 26, 9) has eased out of August’s deep negative zone and crossed into a modestly positive stance. The MACD line now sits just above the signal line, and the histogram has crept above zero. This shift indicates momentum has stabilized after the late-summer pullback and is starting to tilt in favor of buyers.
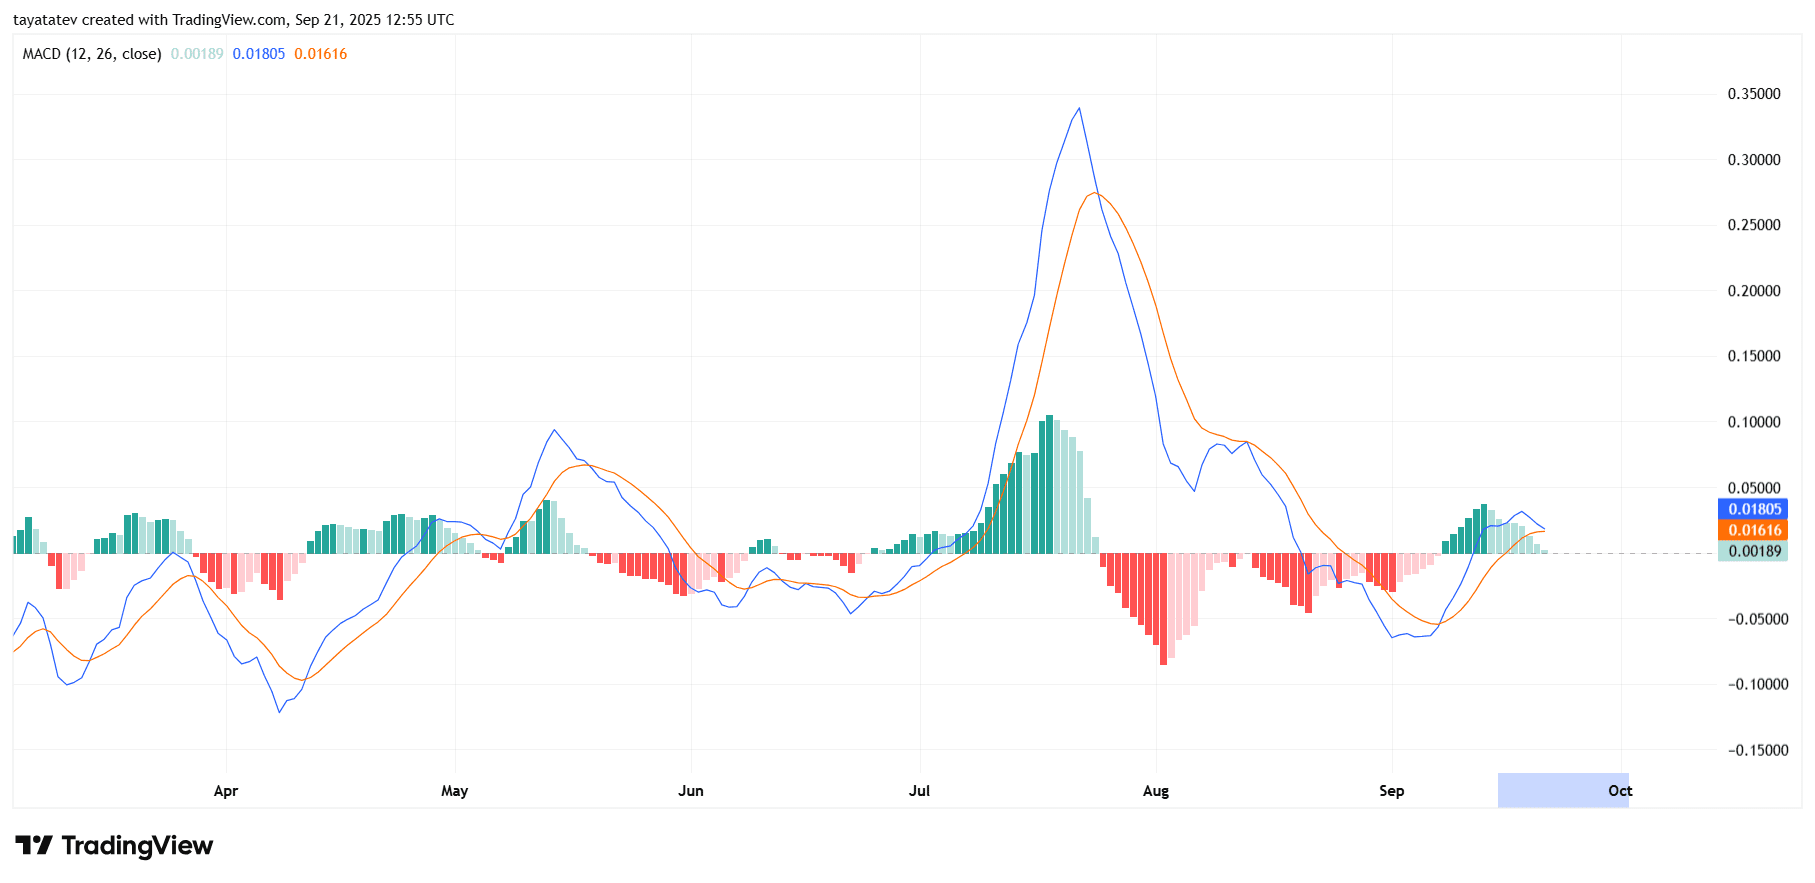
The structure remains early. The gap between the MACD and the signal line is narrow, and the latest histogram bars have softened compared with last week. That pattern shows improving but fragile momentum rather than a decisive trend. Bulls typically want to see the histogram hold above zero and expand for several sessions; bears look for a quick curl lower that would flip the lines back into a sell crossover.
Context matters. The positive turn arrived alongside a multiweek consolidation on price charts, which often precedes a directional move. If the histogram builds higher while price holds above nearby moving averages, momentum confirmation strengthens. If the lines roll over and the histogram dips below zero again, it would signal fading energy and a likely return to range behavior.
XRP’s daily Relative Strength Index (RSI 14) sits around 49.9 today, hovering near the midpoint after a brief climb toward the low-60s earlier in September. The RSI’s signal line on the chart—an overlayed moving average—prints near 54.2, now slightly above the RSI itself, which indicates momentum has softened in recent sessions.
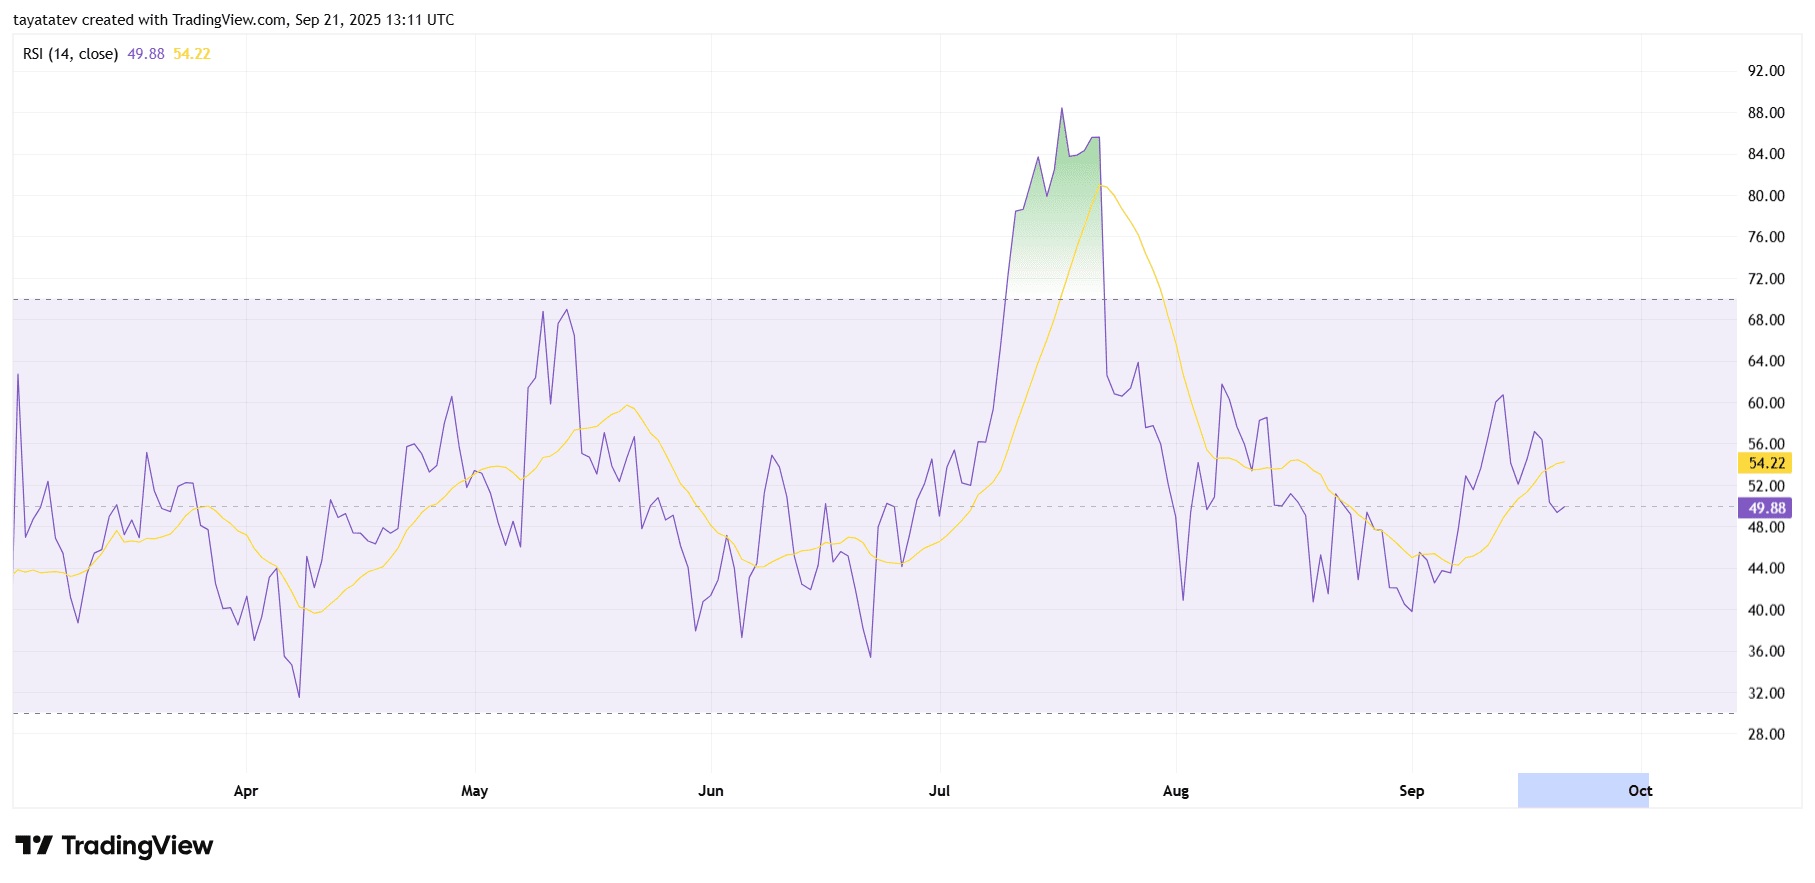
The indicator’s path frames the summer cycle. In late July the RSI shot into overbought territory above 70 and peaked near the mid-80s, then slid through August into the 30s as upside pressure faded. Since early September, RSI rebounded to neutral-positive levels but failed to sustain a push beyond 60, showing buyers have not yet reasserted firm control on the daily timeframe.
This positioning carries straightforward read-through for trend watchers. An RSI near 50 usually signals range conditions rather than directional conviction, so the next impulse likely depends on whether momentum rebuilds above 55–60 or slips back under 45. If the RSI turns higher and recaptures the signal line while price holds recent supports, bullish momentum strengthens; if it rolls lower and the histogram on complementary tools also weakens, consolidation can persist.