

Market watchers are paying close attention after exchange holdings of XRP declined sharply on Binance. According to Xaif Crypto data, reserves went from $10 billion to nearly $3.9 billion.
This represents a 61% decrease in the reserves, indicating that the number of tokens available for immediate sale is decreasing. This is because traders view this as a signal that investors are withdrawing their assets from the trading platforms in the long term.

Source: X
The historical behavior makes this a rather interesting scenario. The peaks in reserves occurred in January and July 2025. After these peaks, prices declined by more than 60%.
This has led to the conclusion that higher exchange reserves imply higher selling pressure. Some traders believe that the current decrease in reserves might slowly reduce the downside risks, provided the buying pressures are constant.
Also Read: XRP Price Prediction 2026-2032: Will XRP Reach $5?
XRP Price Action Remains Under Bearish Structure
Technical analysis from Tradingview: the chart indicates the overall trend of the market is still bearish, as shown in the 2-day technical chart. XRP has had difficulties in trying to bounce back from the time the asset was rejected near the $3 mark.
After the rejection, the asset has been producing lower highs and lower lows, indicating that the overall sentiment of the asset is bearish. Recently, the asset was pushed to the $1.15-$1.20 mark due to the overall selling pressure in the market.
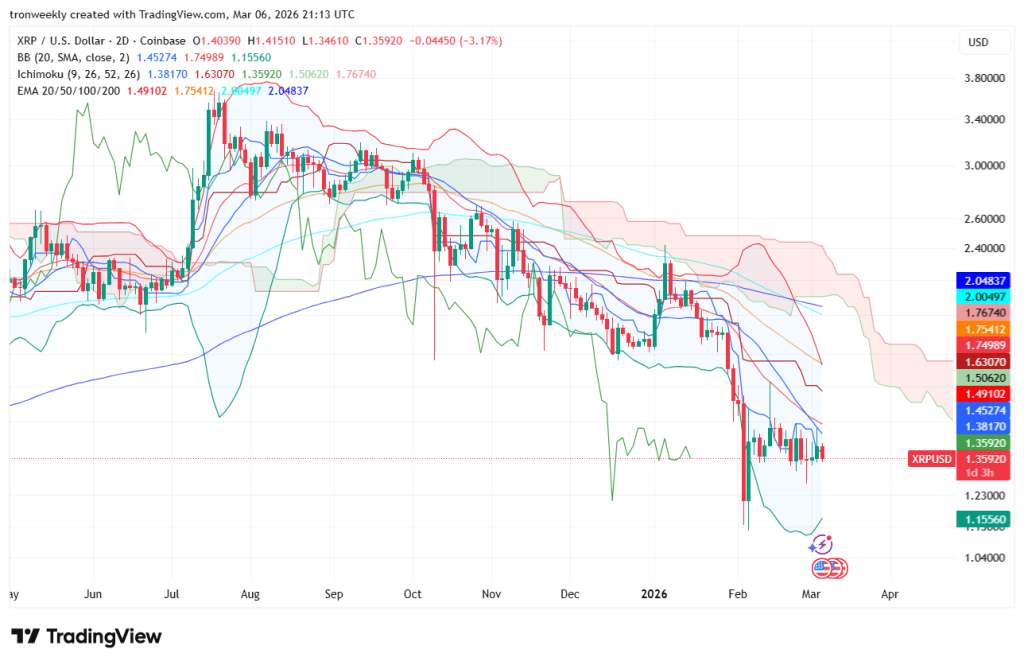
Source: Tradingview
After the dip from the recent fall, the asset has been stabilizing near the $1.35 mark, indicating that the asset is trying to find support. The long-term moving averages are all above the price.
The EMA lines at 20, 50, 100, and 200 are ranging from $1.49 to $2.04, forming a strong resistance level. The Ichimoku chart shows a bearish pattern. The price is below the Ichimoku cloud, indicating that sellers are still in control.
Momentum Signals Hint at Possible Relief Move
Some of the indicators are showing that the strength of the bears is easing slightly. The Relative Strength Index is in the high 30s, which is not highly oversold for a bearish position.
This could indicate that the bears are losing strength. At the same time, the MACD histogram is also leveling out. There is a possibility of a bullish crossover if the buying continues to show strength.

Source: Tradingview
If the selling pressure continues, the $1.15 level could be tested. If the price falls below this level, it could increase the risk to the $1.00 level. If the price moves above the $1.49-$1.63 level, it could see more buying pressure.
Also Read: XRP Price Consolidates Near $1.41: Could a Breakout Toward $15 Be Next?