

Zcash (ZEC) is in a neutral-to-bearish setup, as BTC is consolidating below $70,000, putting the market in a critical position. The ZEC price, according to CoinMarketCap, as of Friday, March 6, has declined by 8.99% and 2.84% over the last week.
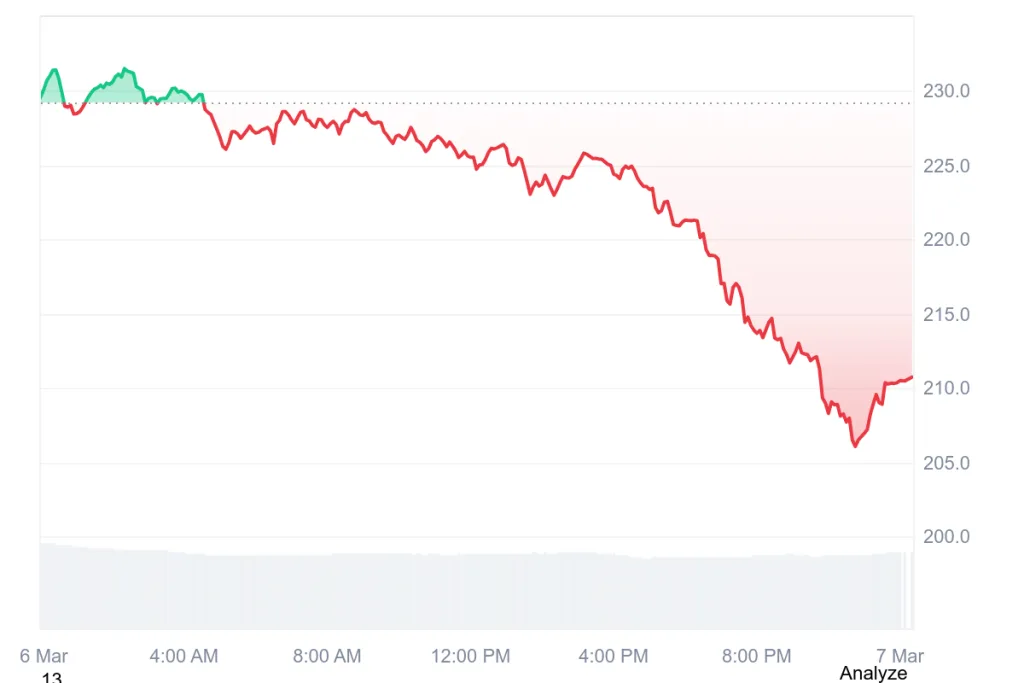
At the time of writing, ZEC is trading at $210.17 with a trading volume of $283.26 million, declined by 8.81% over the last 24 hours. Furthermore, its market capitalization stands at $3.48 billion, pushing the token to a critical stage.
Also Read: Zcash (ZEC) Could Break Above the Bearish Channel or Continue Falling
Long-Term Cup Pattern Signals Possible Breakout Zone
The weekly ZEC chart shows a large cup formation, a bullish long-term pattern. Price dropped from around $300 in 2021 to nearly $20, then slowly recovered.
Now it is approaching the key resistance zone near $250–$270, where strong selling pressure previously appeared in the market.
According to the crypto analyst Dami-Defi, ZEC is consolidating near the resistance area after a strong rally. This sideways movement usually indicates accumulation before another move.
If price holds above $200 and breaks $270 with strong volume, the market could continue upward toward $320, $400, and possibly higher levels.
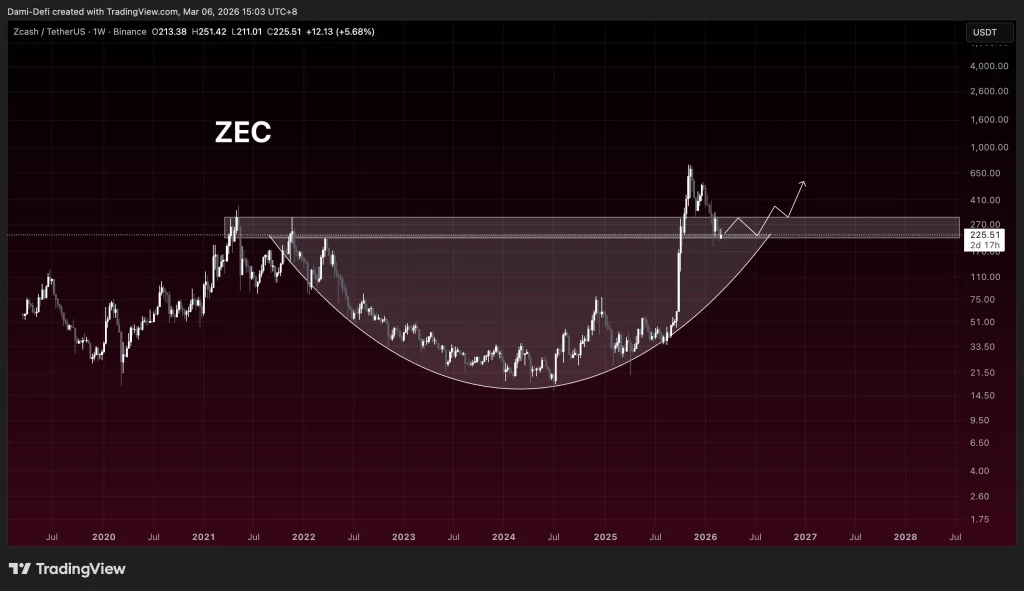
If the resistance is broken, the cup pattern suggests that the price may rise to $500 or $600. On the other hand, if the price falls below $200, it may correct to $170 or $140. Overall, the long-term structure is still bullish if all major supports are still intact.
RSI and MACD Show Weak but Stabilizing Momentum
According to TradingView, the Relative Strength Index (RSI) is at 37.41, whereas the moving average is at 38.74. This places the momentum in the lower neutral region, favoring the influence of bearish pressure, but it is not yet oversold.
The Relative Strength Index (RSI) is showing weaker buying power and is consolidating the sentiment, depending on the buying power.
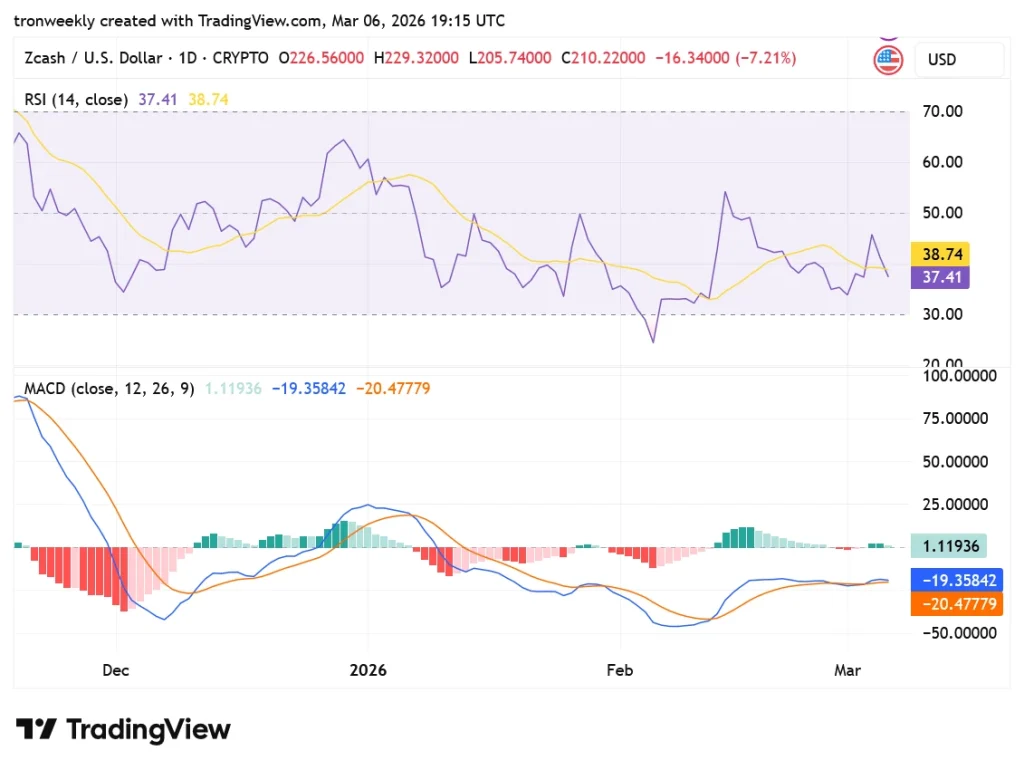
The MACD indicator shows that the MACD line is at -19.35842, and the signal line is at -20.47779. The histogram is at 1.11936, which indicates that there is some bullish movement developing after a prolonged bearish trend. However, both lines are still below zero, which indicates that the trend is still weak.
Why This Matters
If the price breaks through the resistance level of $270, this will signify a strong continuation of the bullish momentum, and the price will attract many buyers.
Losing the support level of $200 will make the selling pressure stronger, leading to a fall in the price to levels of $170 or $140.
Also Read: Zcash (ZEC) Trendline Test Signals a Potential Breakout Toward $600